Trading Services Directory
Before choosing a provider, verify its official terms, trading costs, risks and regional availability. This directory is a research starting point, not a promise of profits or challenge passes.
 NEXUSDAO
Some links contain referral parameters and may generate a commission. Fees, regulation, availability, withdrawals and evaluation terms can change. Verify the legal entity, official disclosures and current agreement before you register.
NEXUS DAO comparison pages are designed as due-diligence checklists to help readers identify questions to verify with official sources. They do not present a universal ranking or guarantee that a provider is suitable.
Provider terms can change. Do not assume current fees, regulation, access or rankings from this page; verify details with official sources before registering.
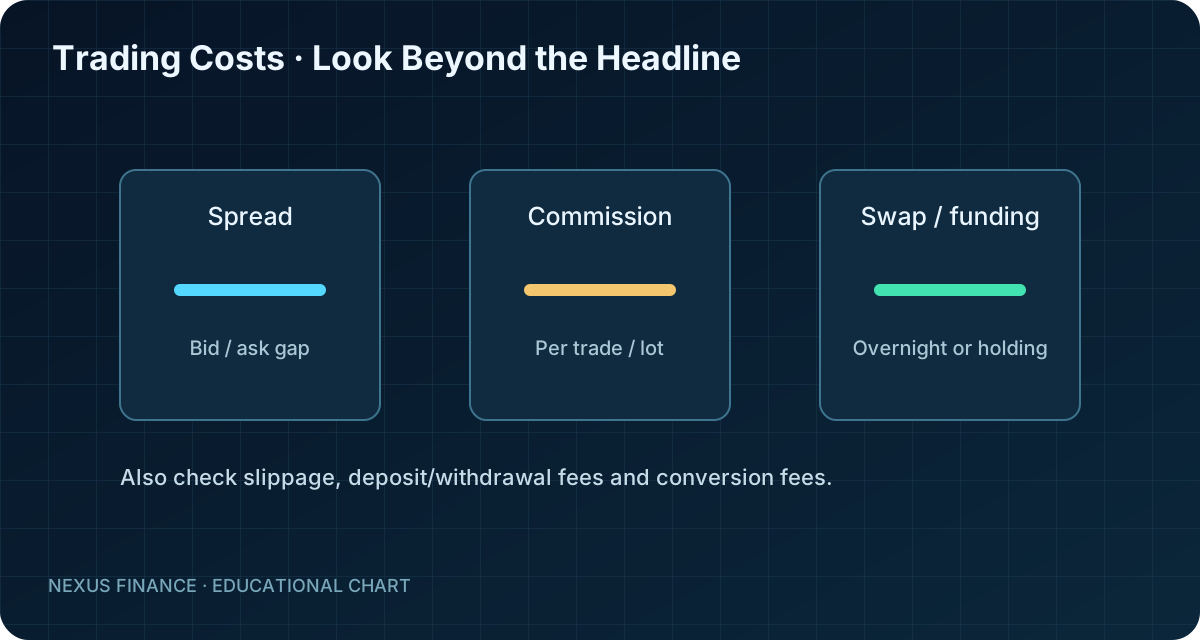
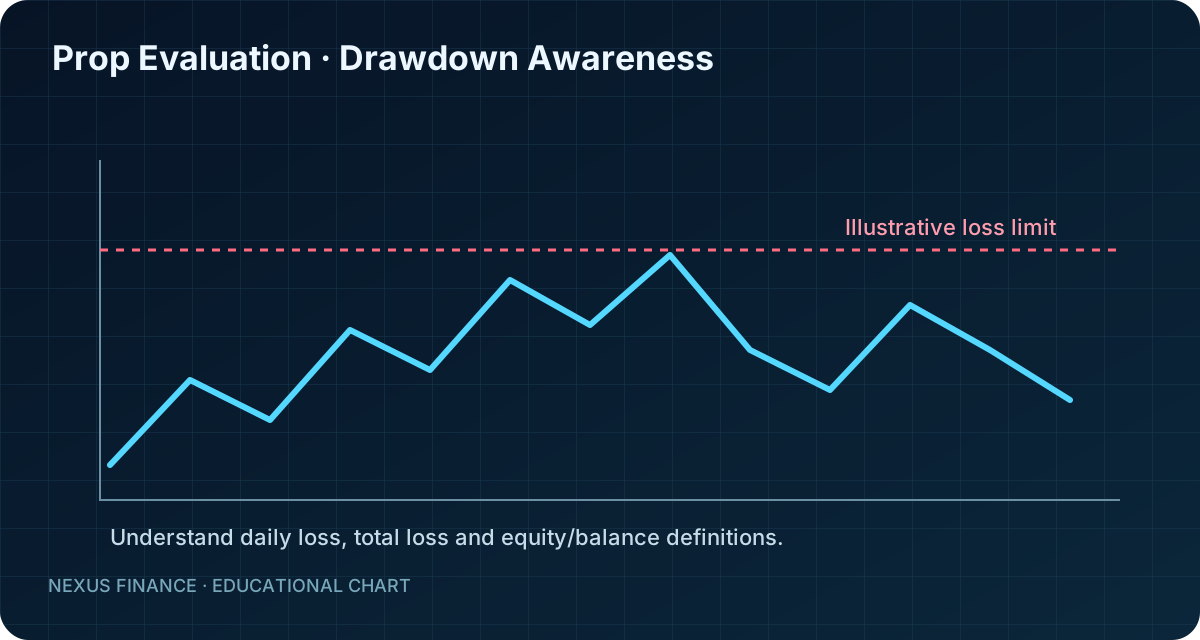
Before choosing a provider, verify its official terms, trading costs, risks and regional availability. This directory is a research starting point, not a promise of profits or challenge passes.
No. Listing order is not a ranking or endorsement. Compare official terms against your location, experience and trading approach.
Some links contain referral parameters. Where a referral commission may be earned, we disclose it and encourage review of official terms.
No. Historical or simulated performance does not guarantee future outcomes, and prop-firm evaluations and payouts are governed by each firm’s rules.
Each provider is scored from 0 to 10 on seven axes that describe how clear and comparable its published information is. An axis with no basis is shown as N/A, never as 0. The overall value is the plain average of the valid axes, and it is shown only when at least 80 percent of the axes are valid (6 of 7).
| Axis | Score |
|---|---|
| Clarity of rules | 7 |
| Loss-limit calculation | 8 |
| Fees and extra costs | N/A |
| Reward and payout terms | 7 |
| Program and platform choice | 7 |
| Operator and contract transparency | 8 |
| Eligibility and user risk information | 6 |
Six of seven axes are valid, so data coverage is 86 percent and the overall value is the average of those six: (7 + 8 + 7 + 7 + 8 + 6) ÷ 6 = 7.2. The fee axis stays N/A because current prices could not be confirmed. Confidence is “low”, because the rules guide used is dated March 2025.
Differences smaller than 0.3 are treated as equivalent, so 7.7 and 7.9 are not a ranking. The score does not rate safety, regulation or profitability, and it is not a recommendation.
Every figure carries a research date. Terms change, so treat each figure as accurate only as of that date and confirm it on the official page. Changes to a condition we show are recorded with a date and a source in the rule update log.