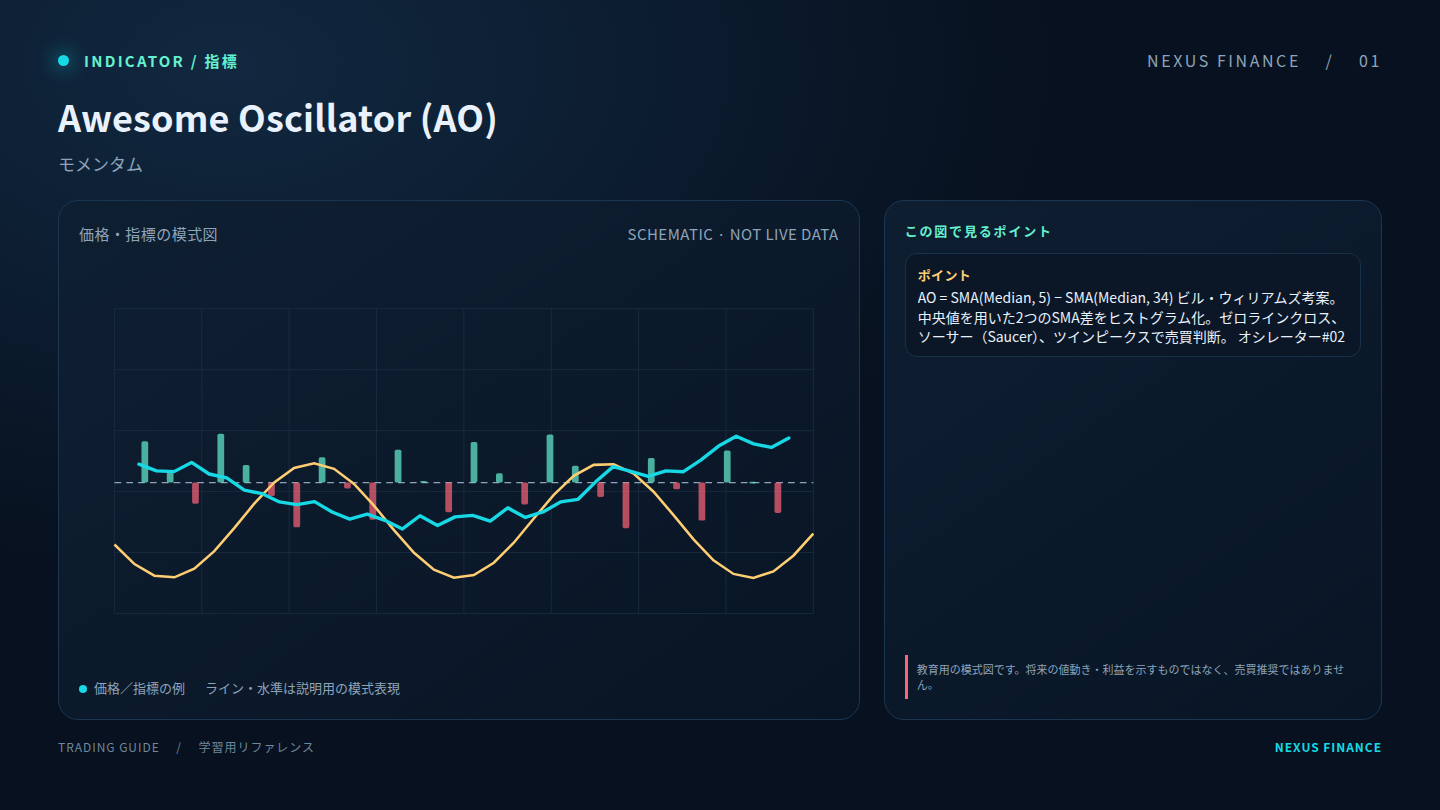
 01 · Momentum
Awesome Oscillator (AO)
Tracks the pace or direction of price movement; overbought/oversold readings can persist during strong trends.
Reference term: Awesome Oscillator (AO)
 NEXUSDAO
A practical learning path through candlesticks, technical indicators, chart patterns, trading rules and risk management. Treat indicators as context—not standalone guarantees—and test every setup against market structure and your risk limits.

A practical learning path through candlesticks, technical indicators, chart patterns, trading rules and risk management. Treat indicators as context—not standalone guarantees—and test every setup against market structure and your risk limits.
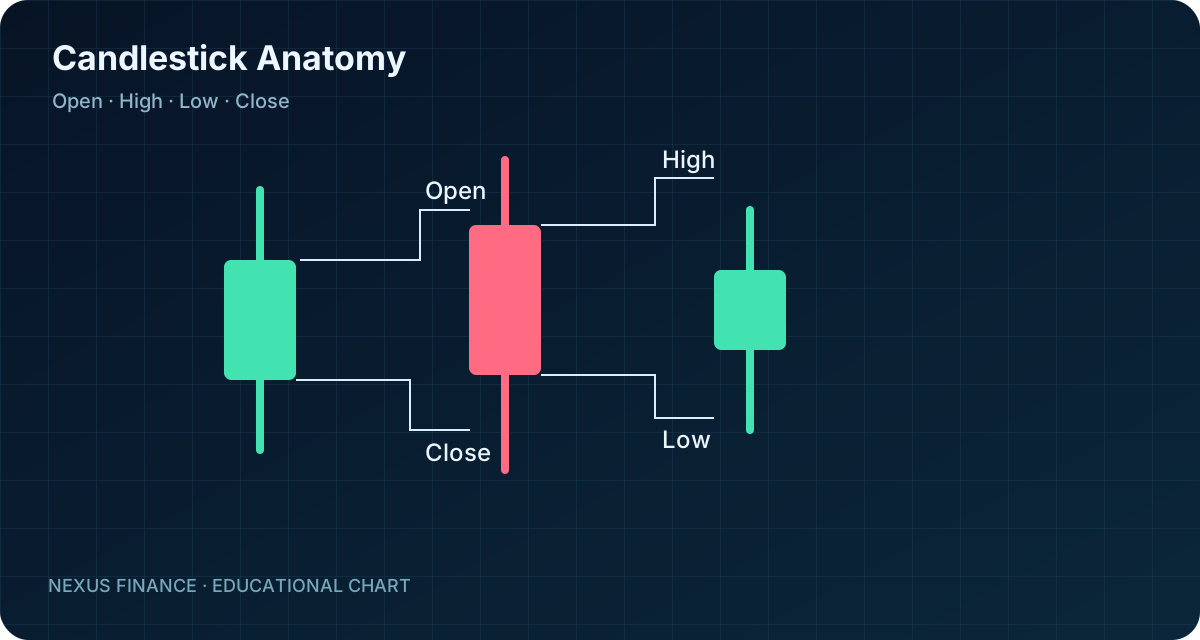
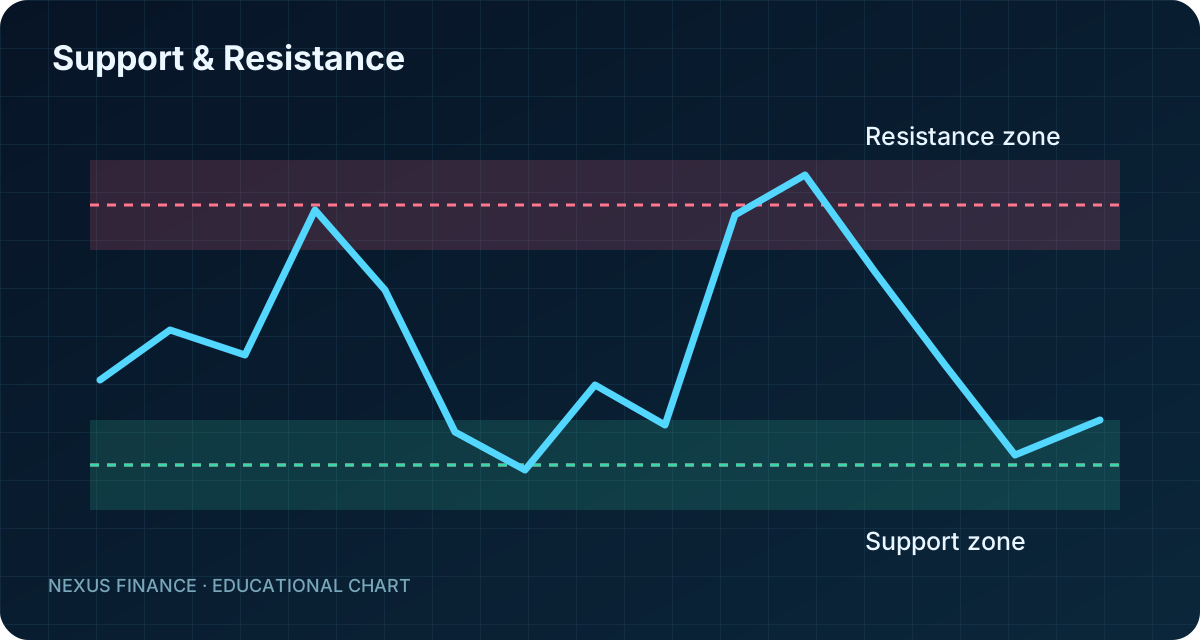
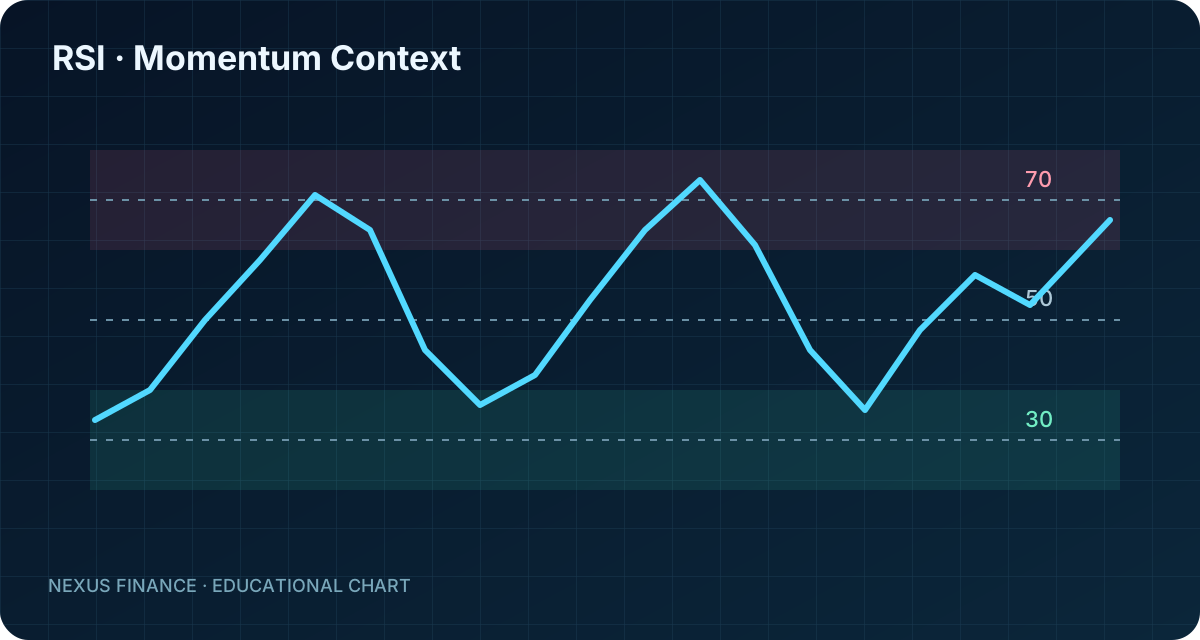
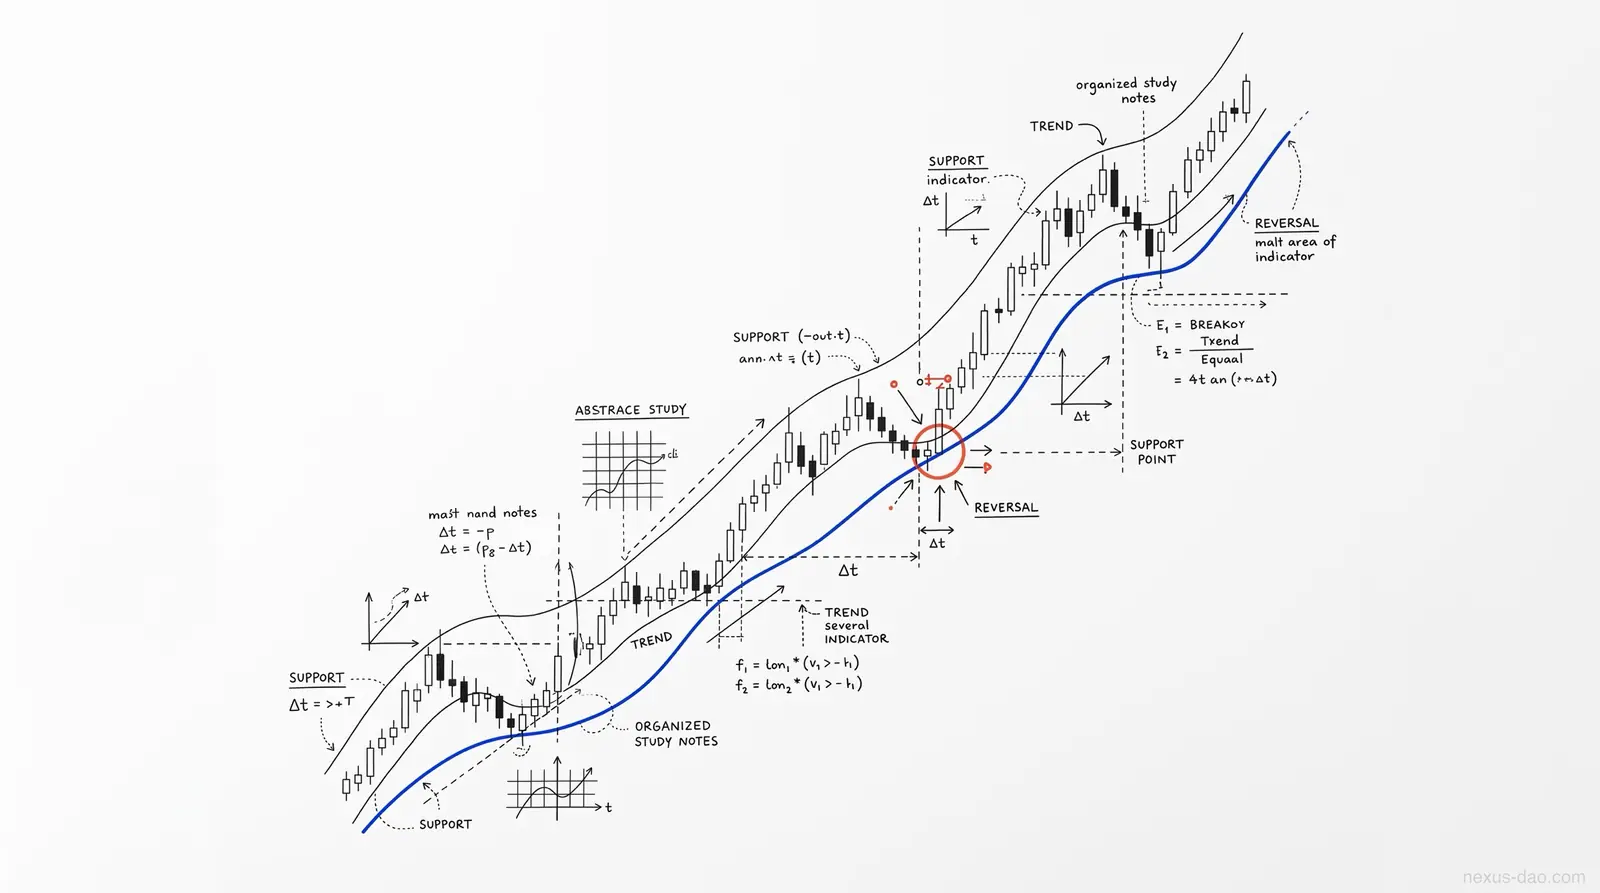


This index covers common indicators. Values can differ with calculation method, lookback period and data source.
01 · MomentumTracks the pace or direction of price movement; overbought/oversold readings can persist during strong trends.
Reference term: Awesome Oscillator (AO)
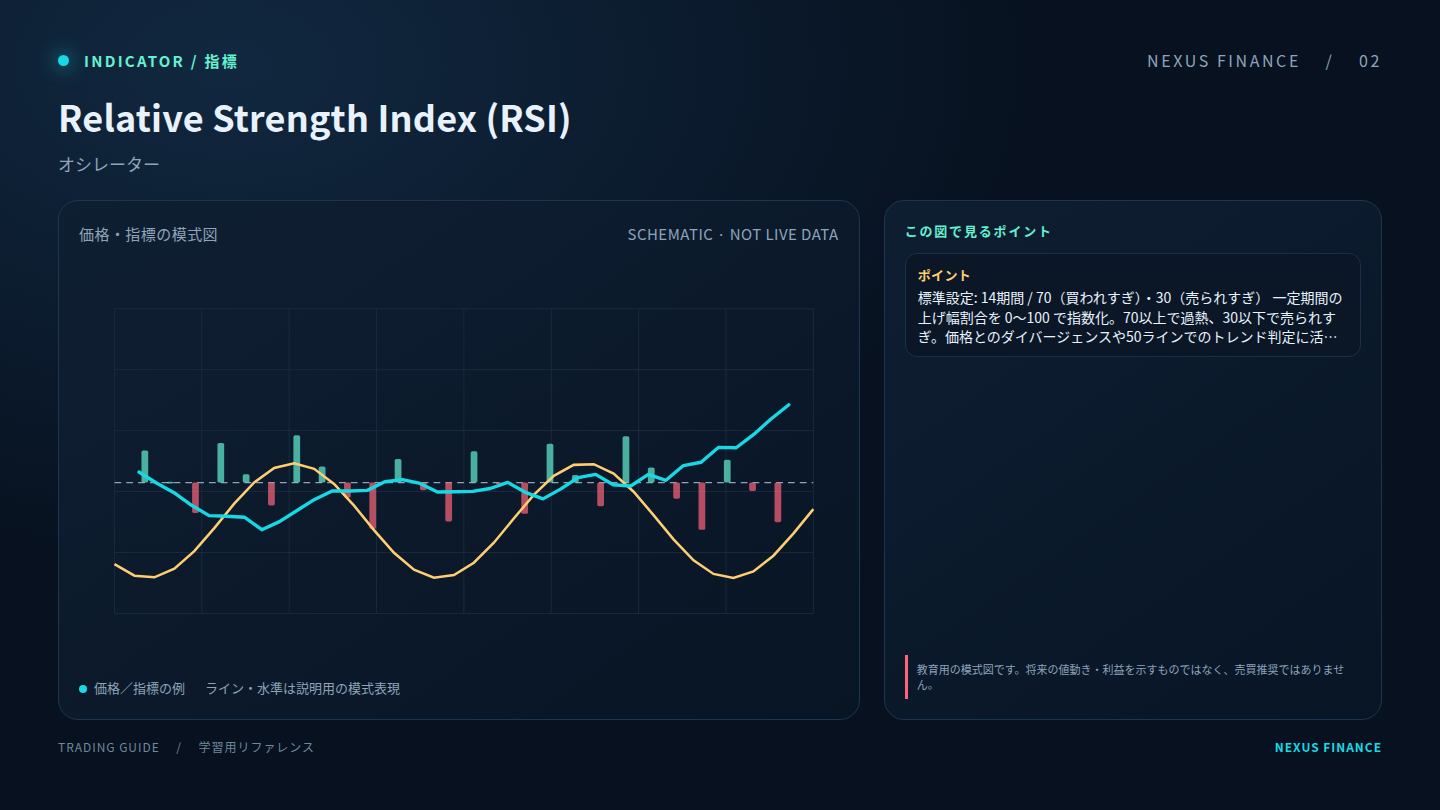 02 · Momentum
Tracks the pace or direction of price movement; overbought/oversold readings can persist during strong trends.
Reference term: Relative Strength Index (RSI)
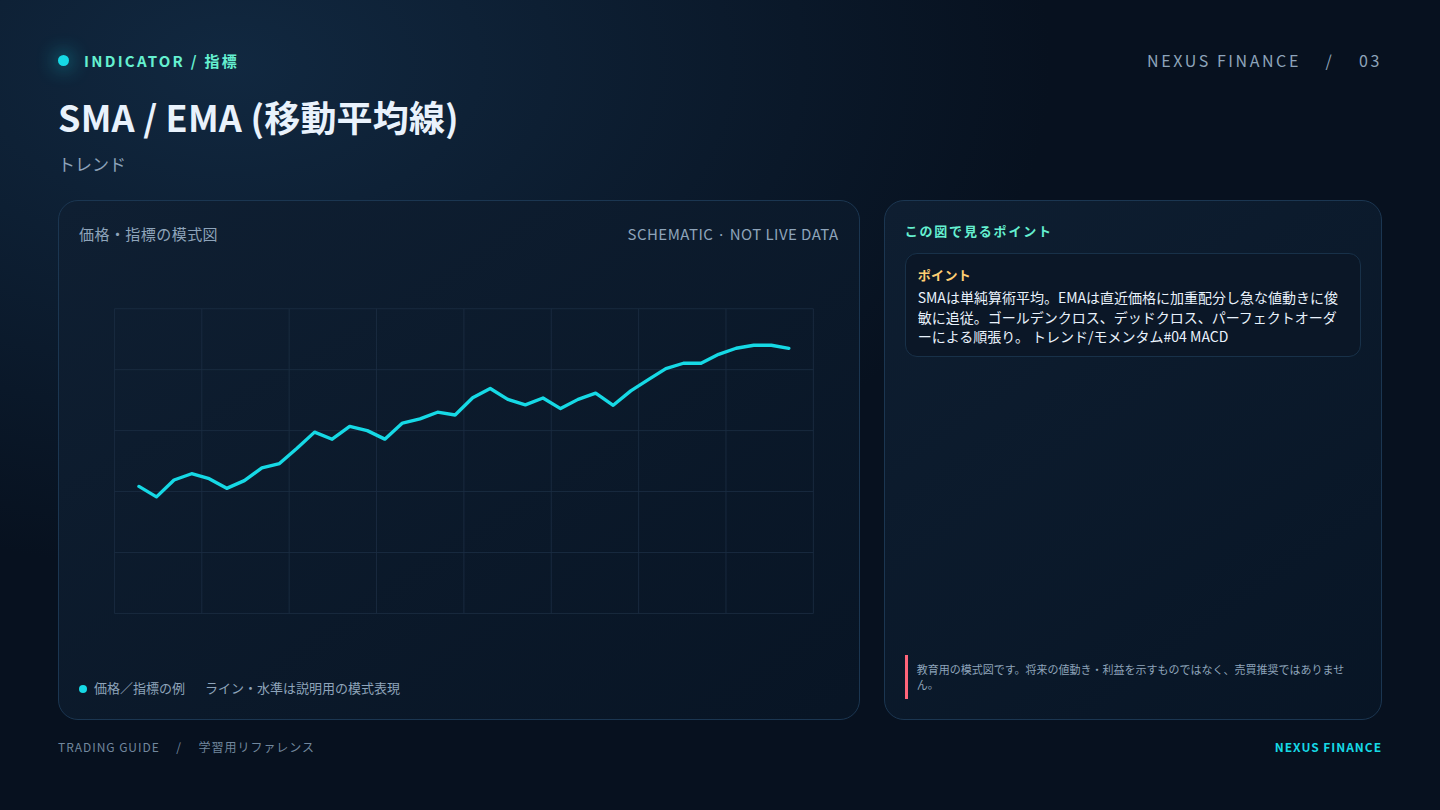 03 · Trend
Helps describe direction or trend strength. Confirm the signal with market structure and a defined exit rule.
Reference term: SMA / EMA
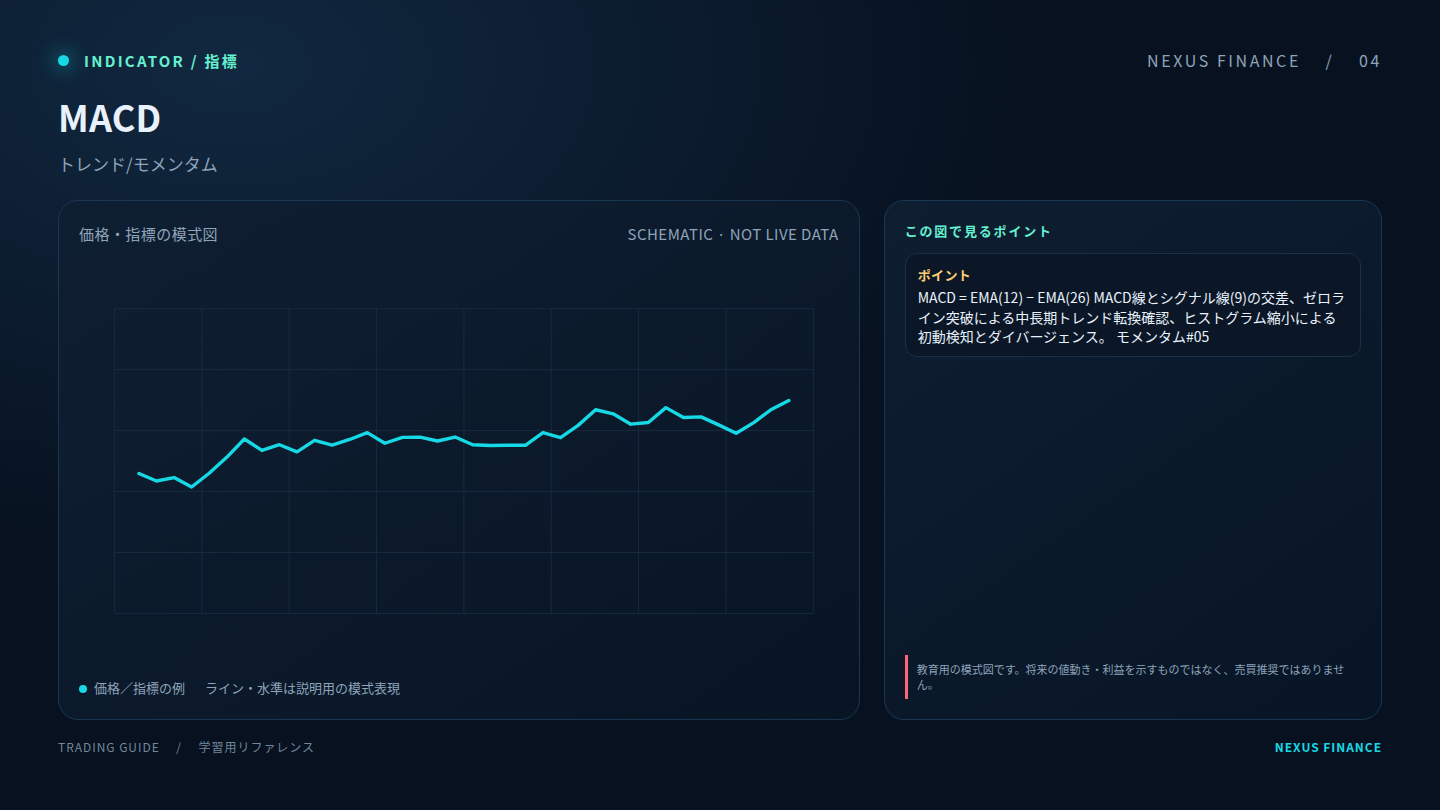 04 · Momentum
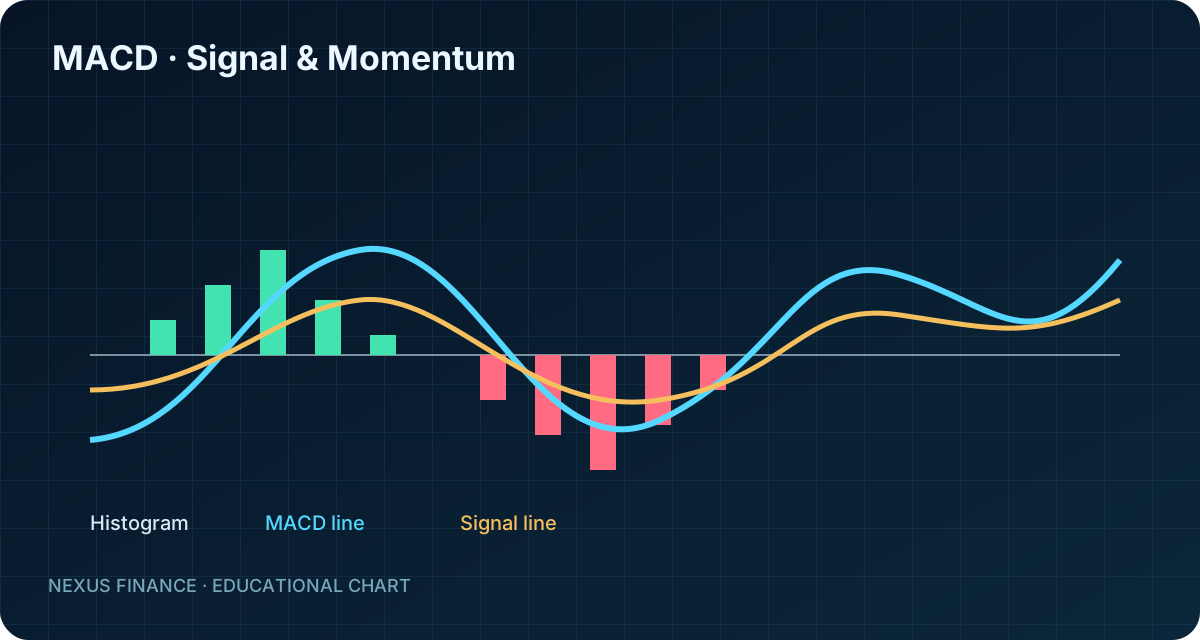
Tracks the pace or direction of price movement; overbought/oversold readings can persist during strong trends.
Reference term: MACD
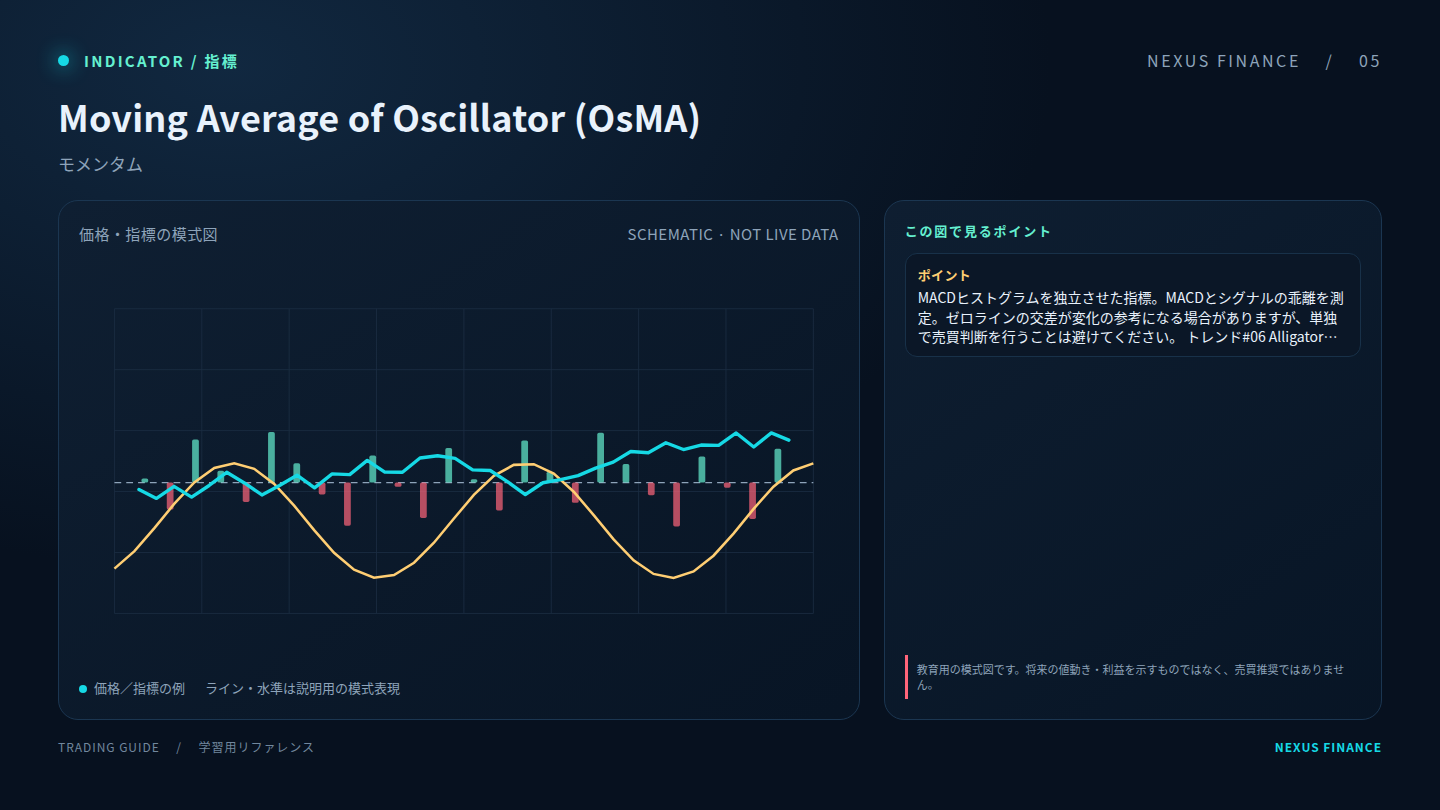 05 · Momentum
Tracks the pace or direction of price movement; overbought/oversold readings can persist during strong trends.
Reference term: Moving Average of Oscillator (OsMA)
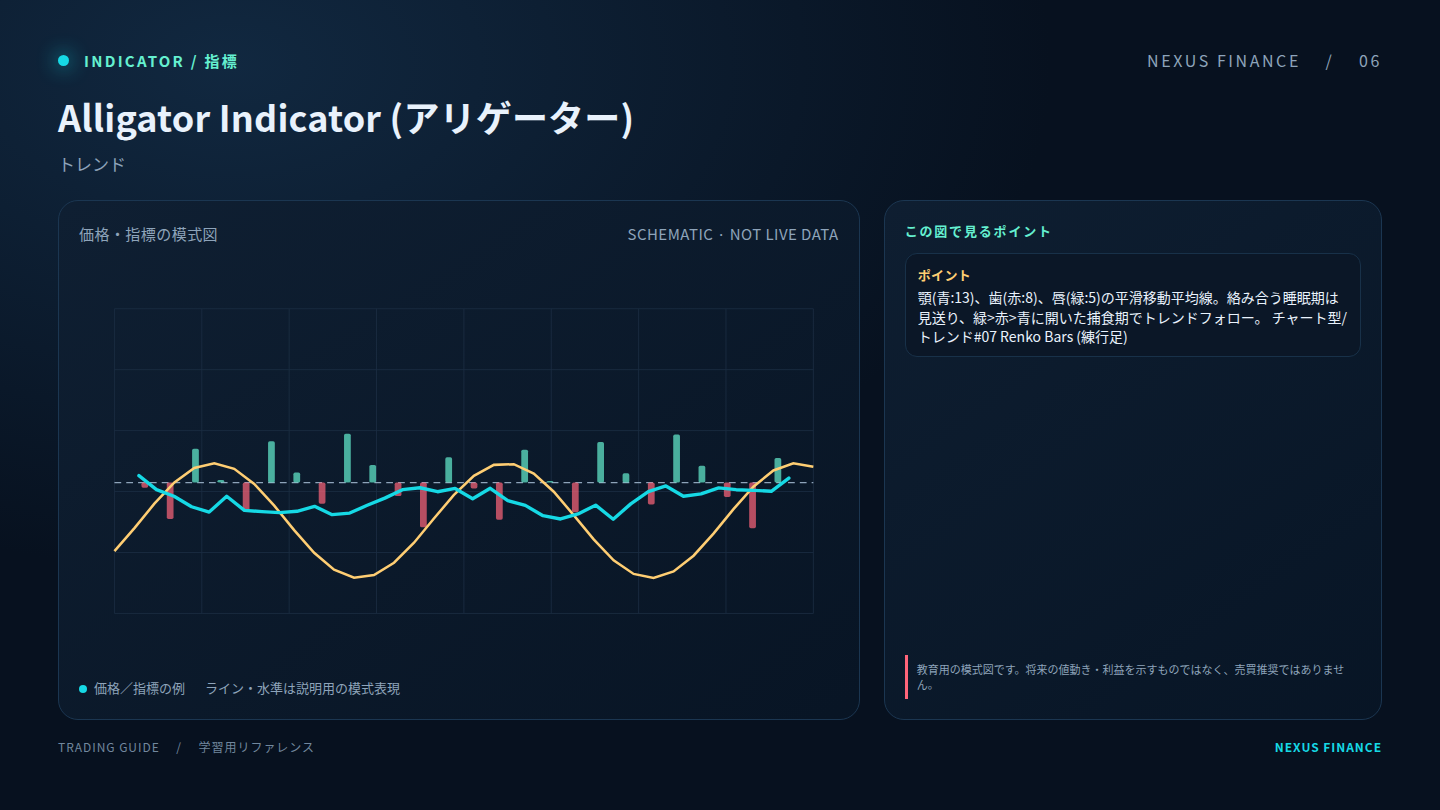 06 · Trend
Helps describe direction or trend strength. Confirm the signal with market structure and a defined exit rule.
Reference term: Alligator Indicator
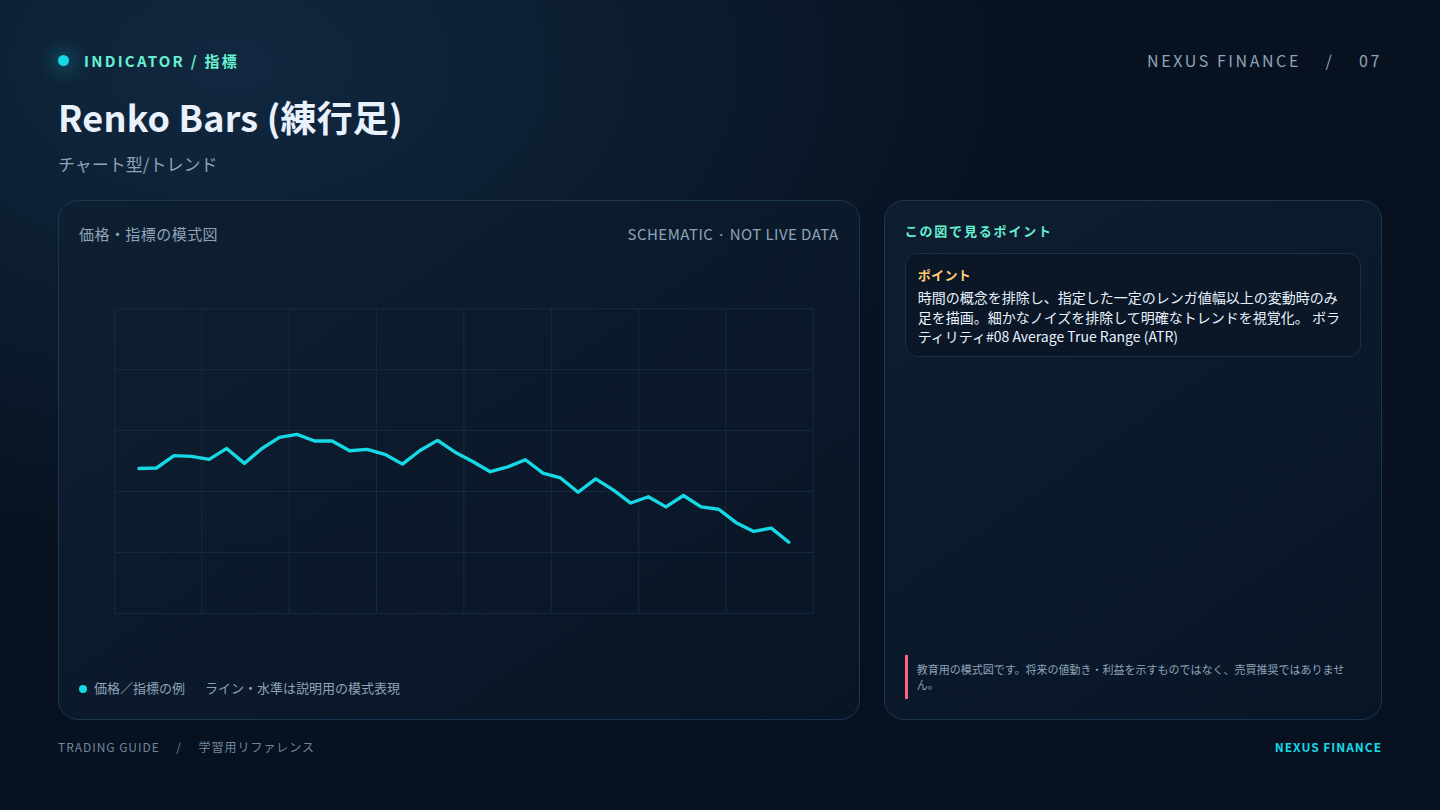 07 · Structure
Simplifies swings or candle presentation to help read structure; settings can change what becomes visible.
Reference term: Renko Bars
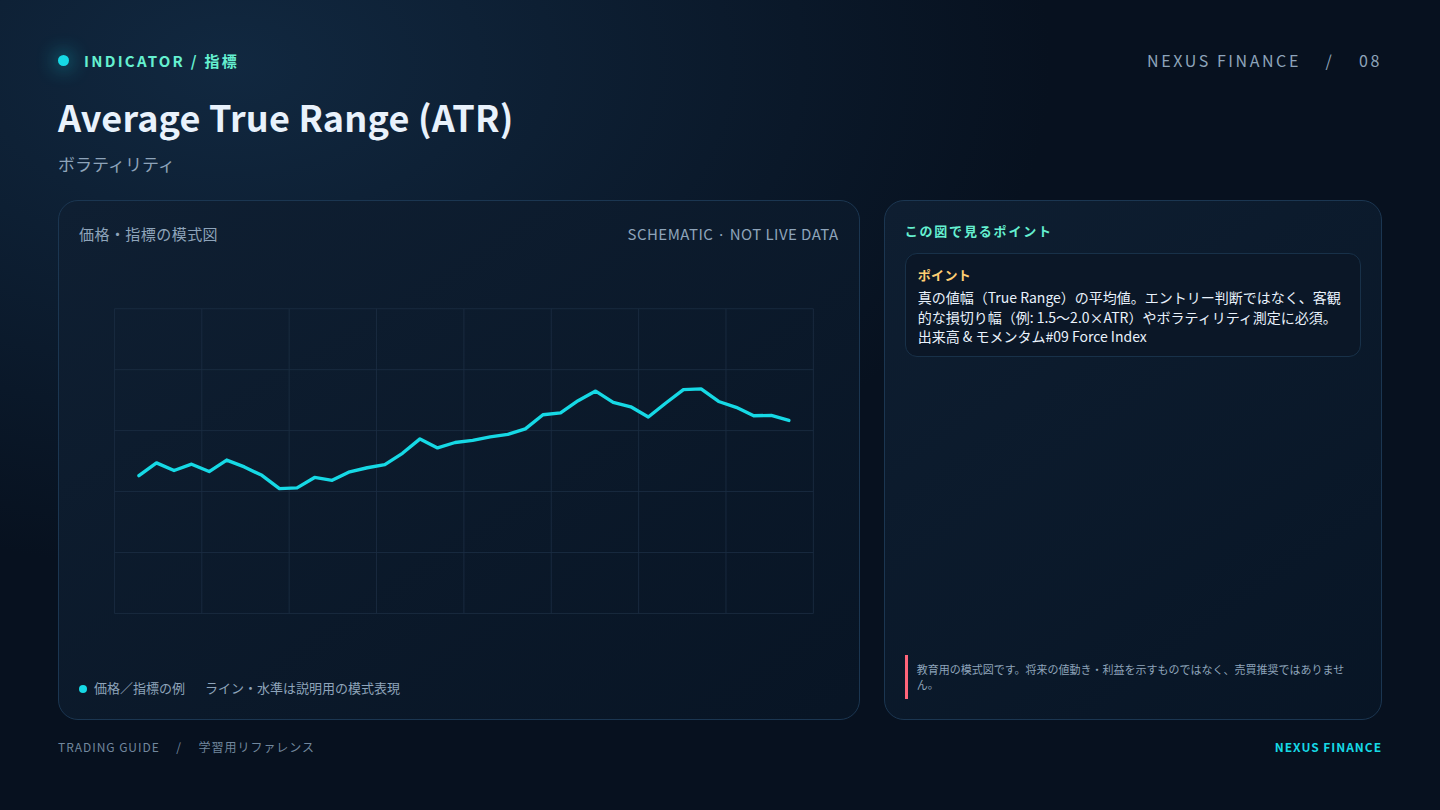 08 · Volatility
Summarizes range or variability. Volatility measures do not predict direction by themselves.
Reference term: Average True Range (ATR)
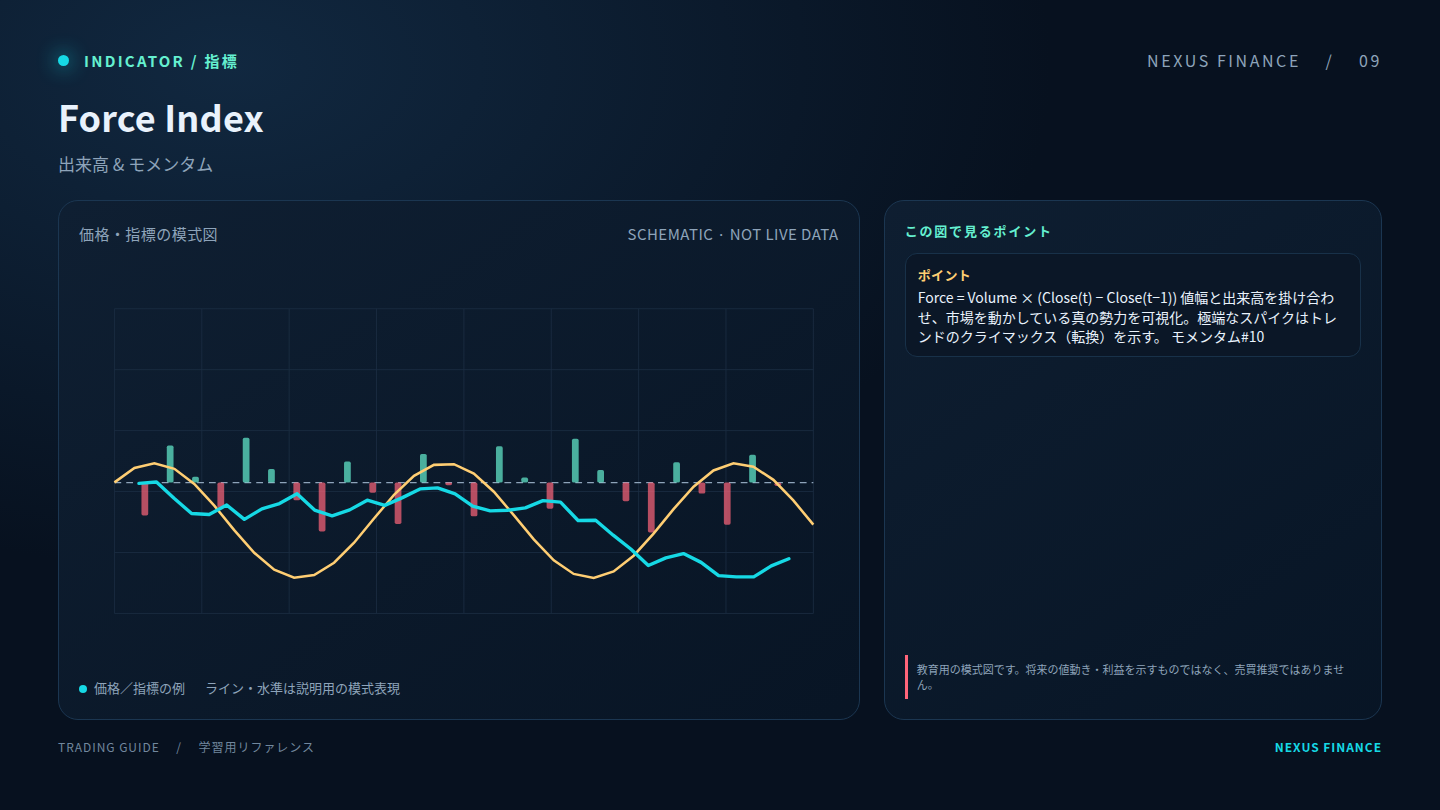 09 · Volume
Uses volume or price-volume relationships where data is available; feed quality and instrument data matter.
Reference term: Force Index
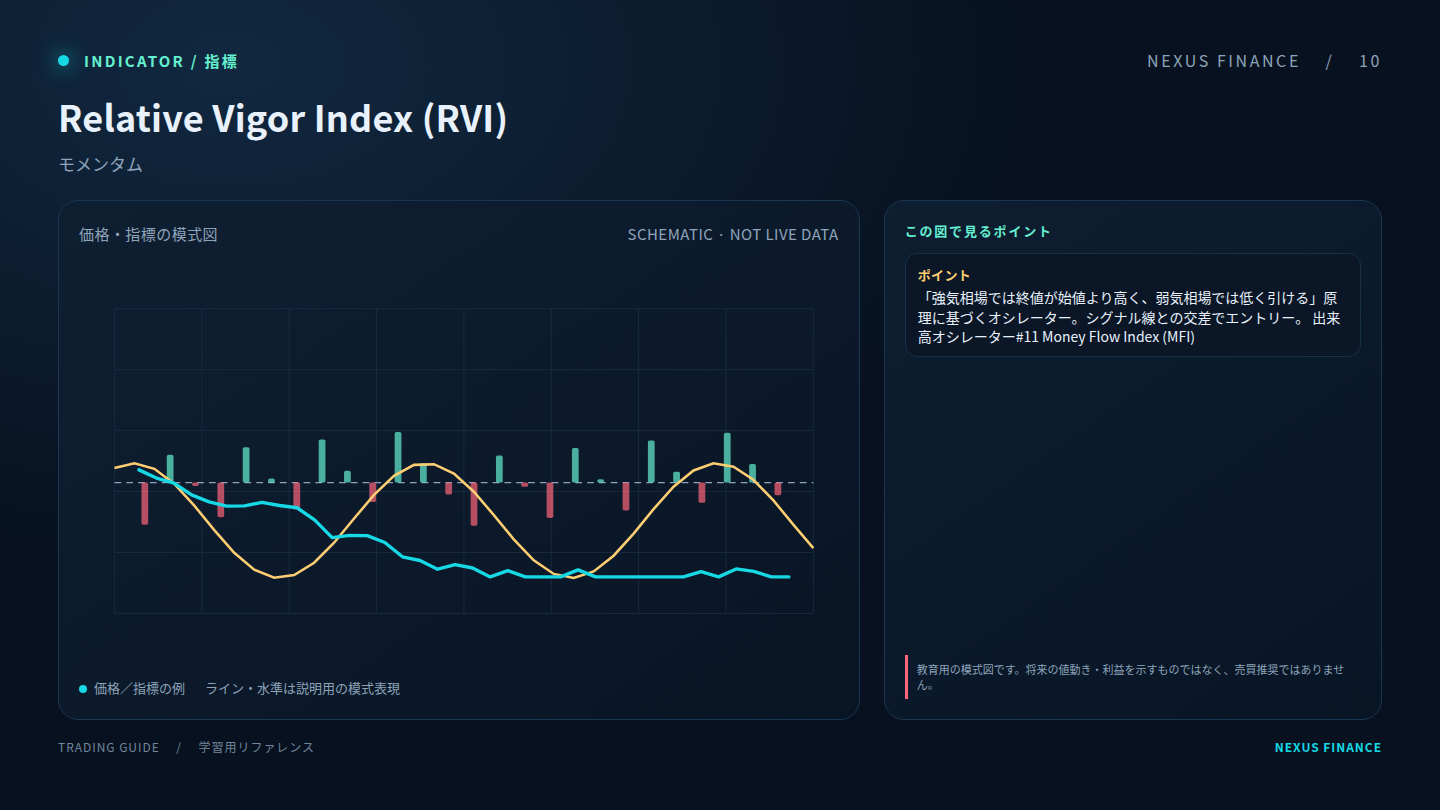 10 · Momentum
Tracks the pace or direction of price movement; overbought/oversold readings can persist during strong trends.
Reference term: Relative Vigor Index (RVI)
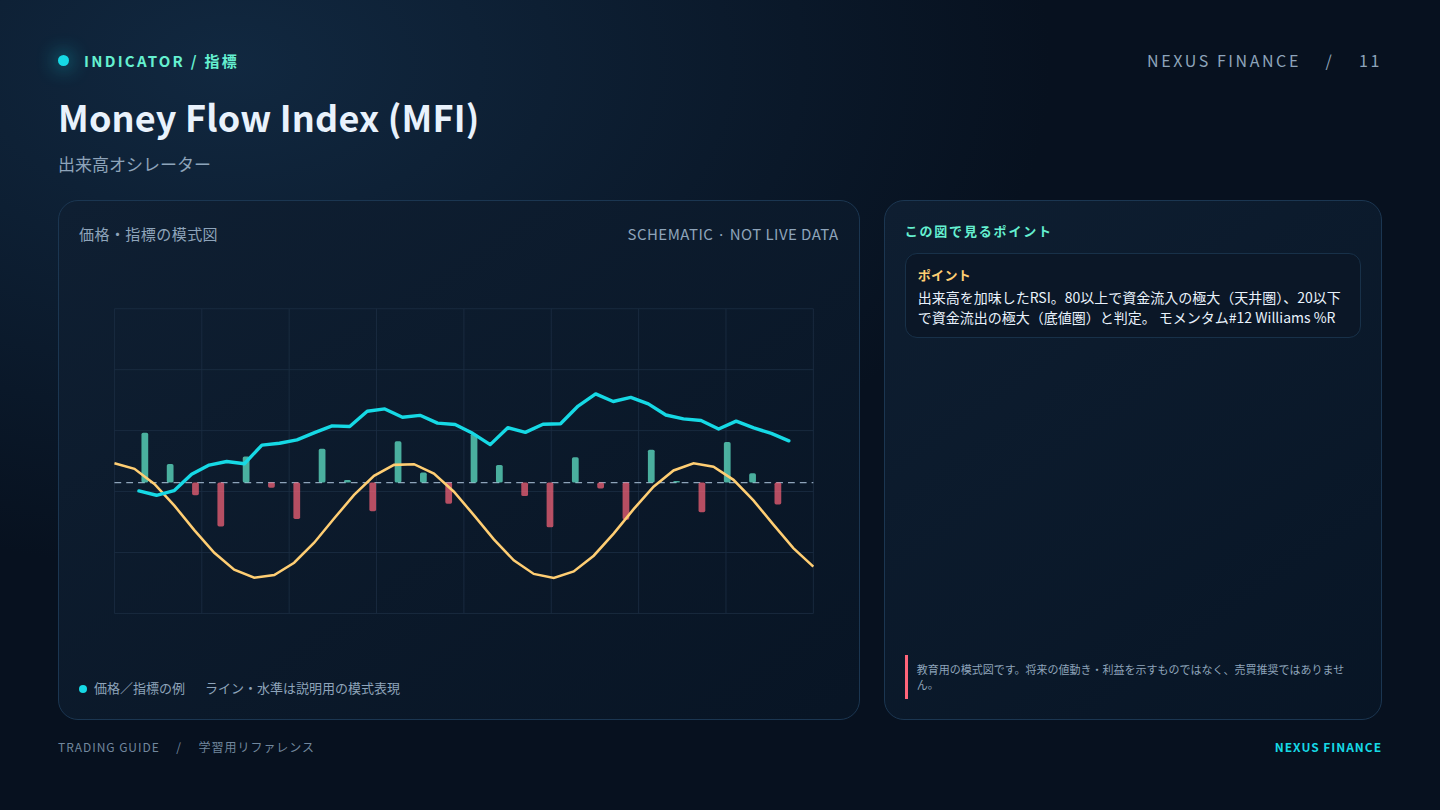 11 · Volume
Uses volume or price-volume relationships where data is available; feed quality and instrument data matter.
Reference term: Money Flow Index (MFI)
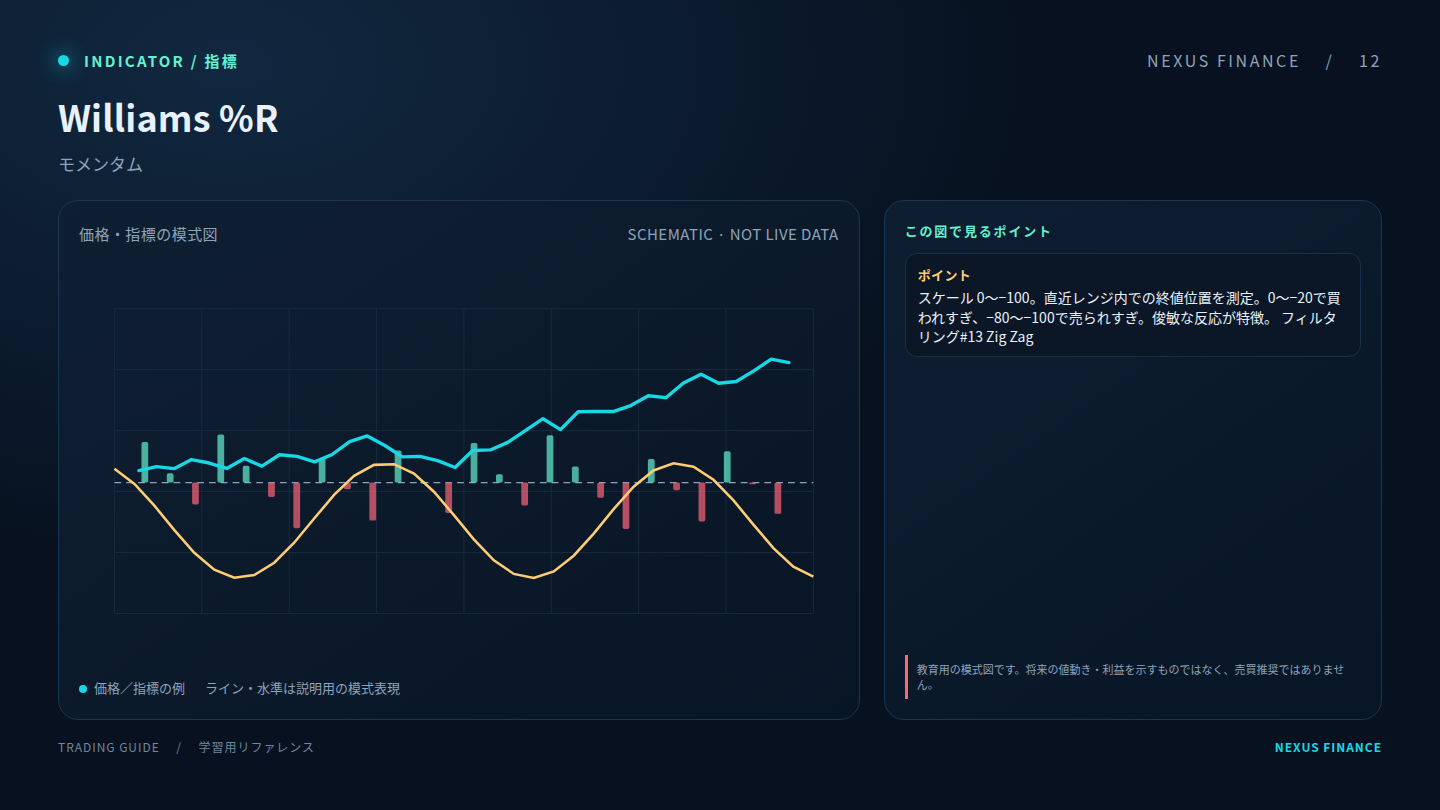 12 · Momentum
Tracks the pace or direction of price movement; overbought/oversold readings can persist during strong trends.
Reference term: Williams %R
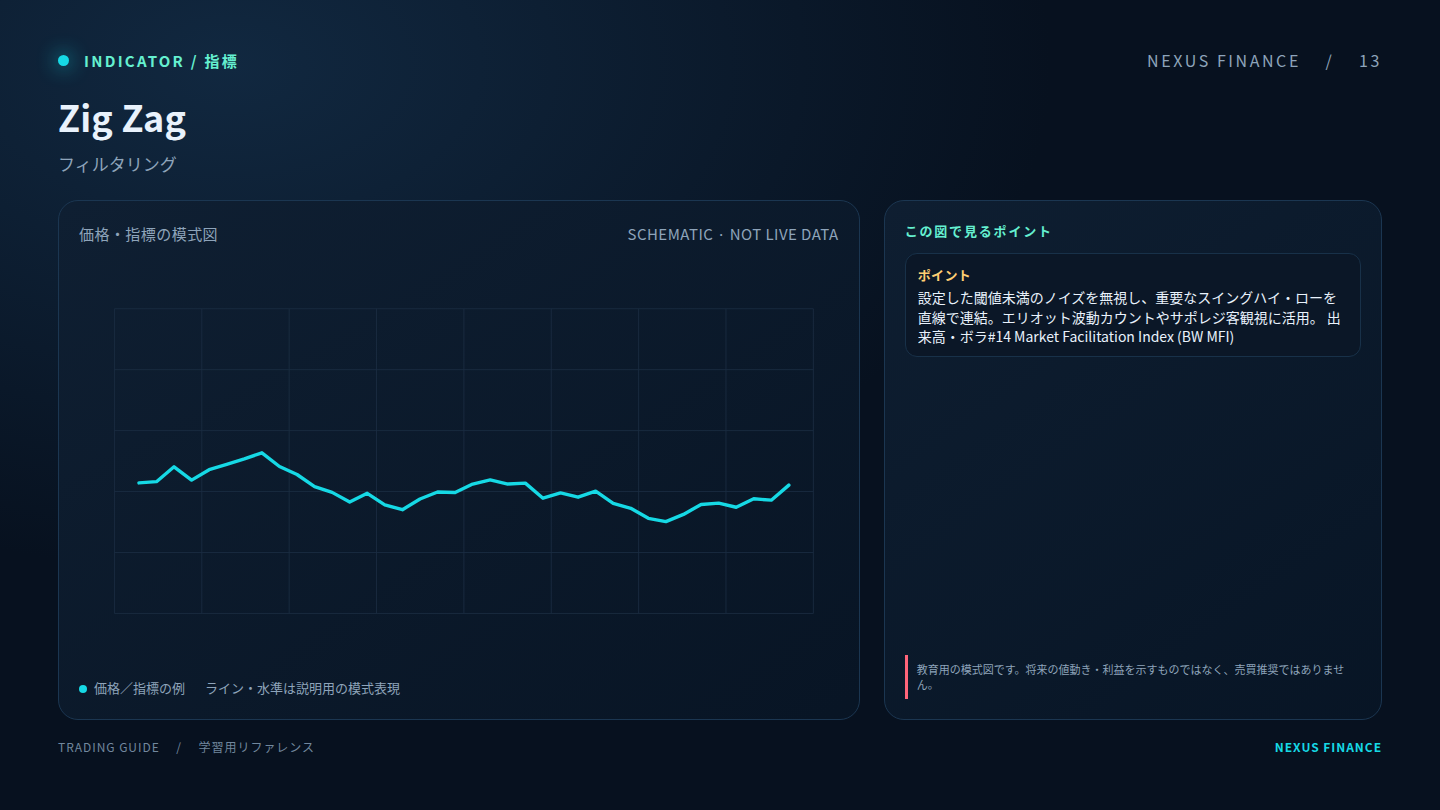 13 · Structure
Simplifies swings or candle presentation to help read structure; settings can change what becomes visible.
Reference term: Zig Zag
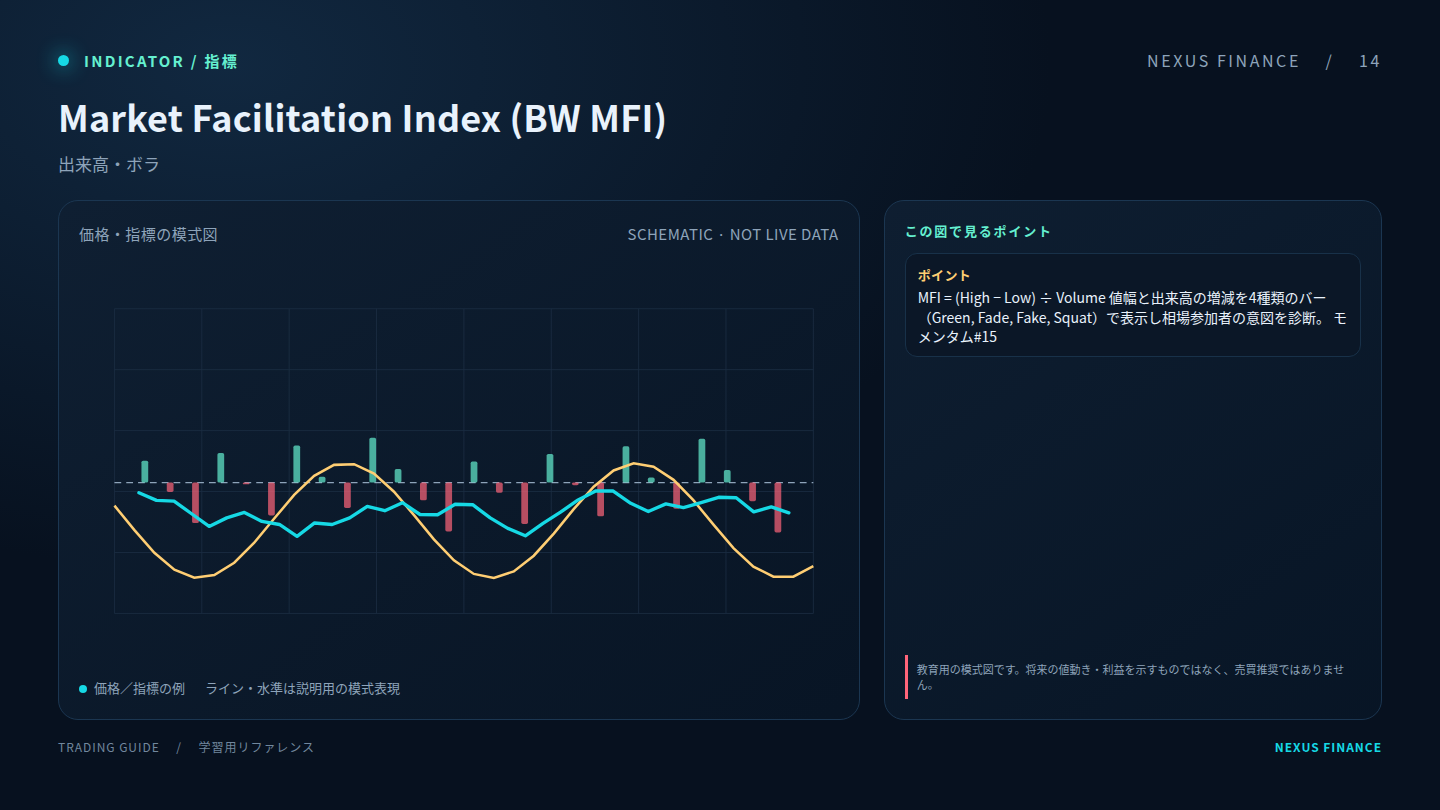 14 · Volume
Uses volume or price-volume relationships where data is available; feed quality and instrument data matter.
Reference term: Market Facilitation Index (BW MFI)
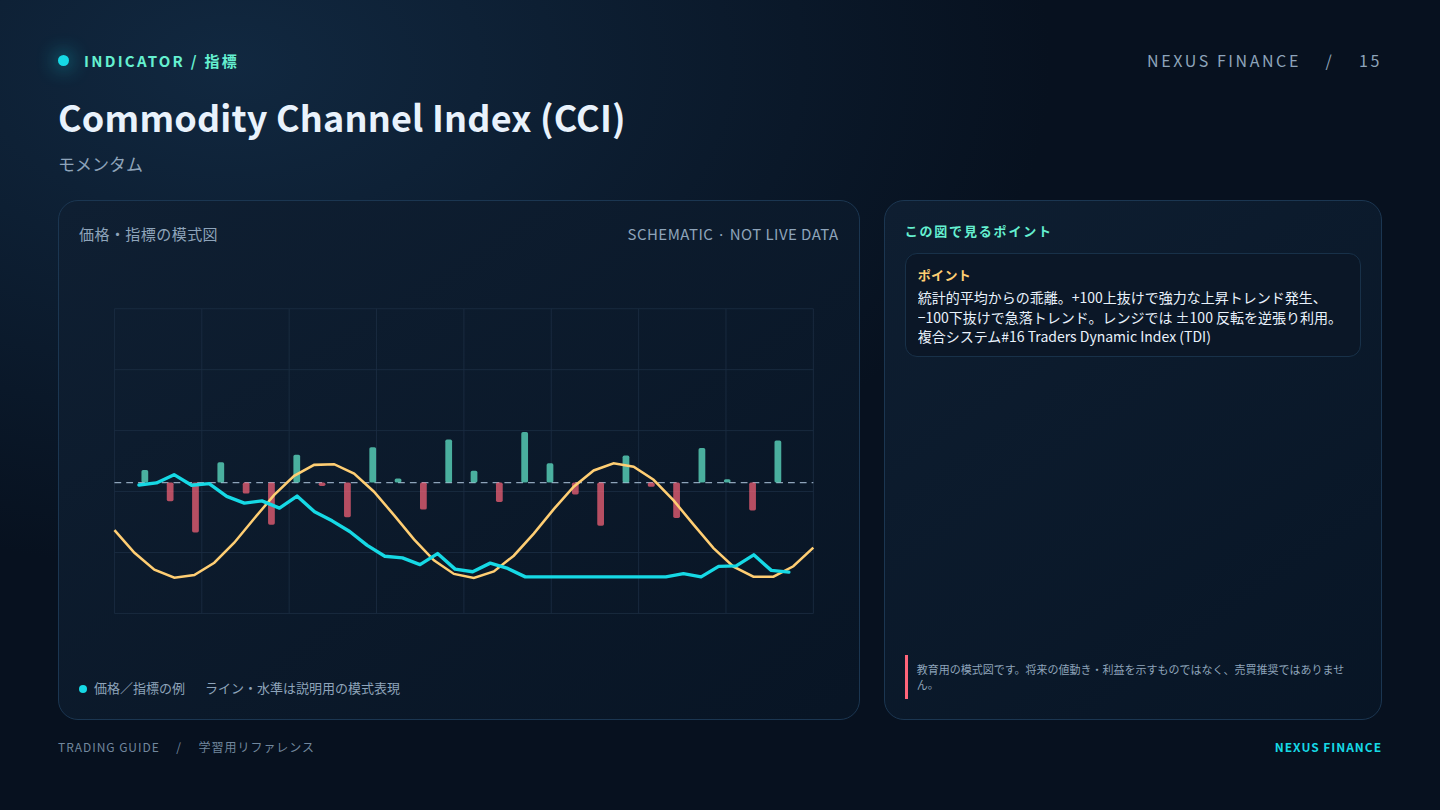 15 · Momentum
Tracks the pace or direction of price movement; overbought/oversold readings can persist during strong trends.
Reference term: Commodity Channel Index (CCI)
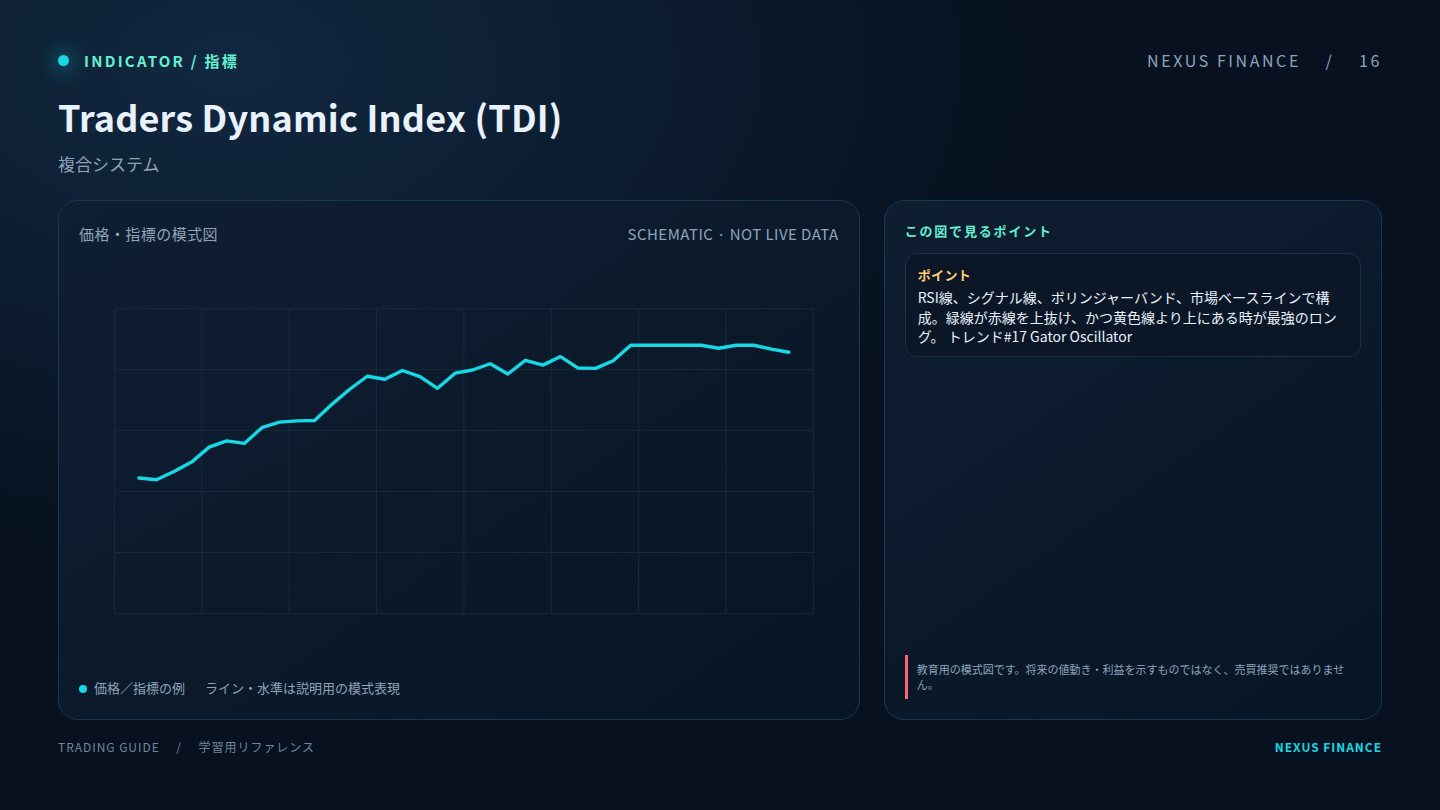 16 · Momentum
Tracks the pace or direction of price movement; overbought/oversold readings can persist during strong trends.
Reference term: Traders Dynamic Index (TDI)
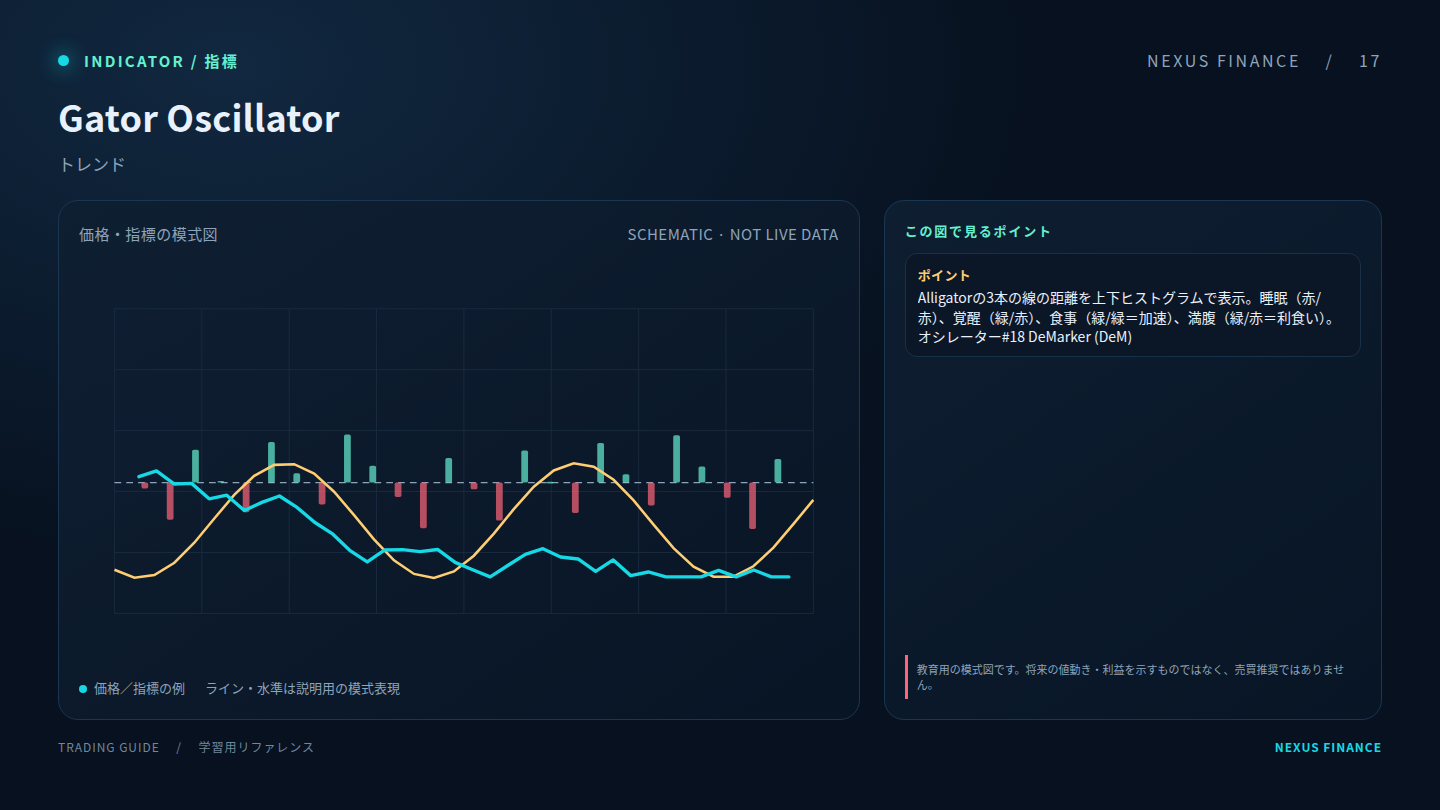 17 · Trend
Helps describe direction or trend strength. Confirm the signal with market structure and a defined exit rule.
Reference term: Gator Oscillator
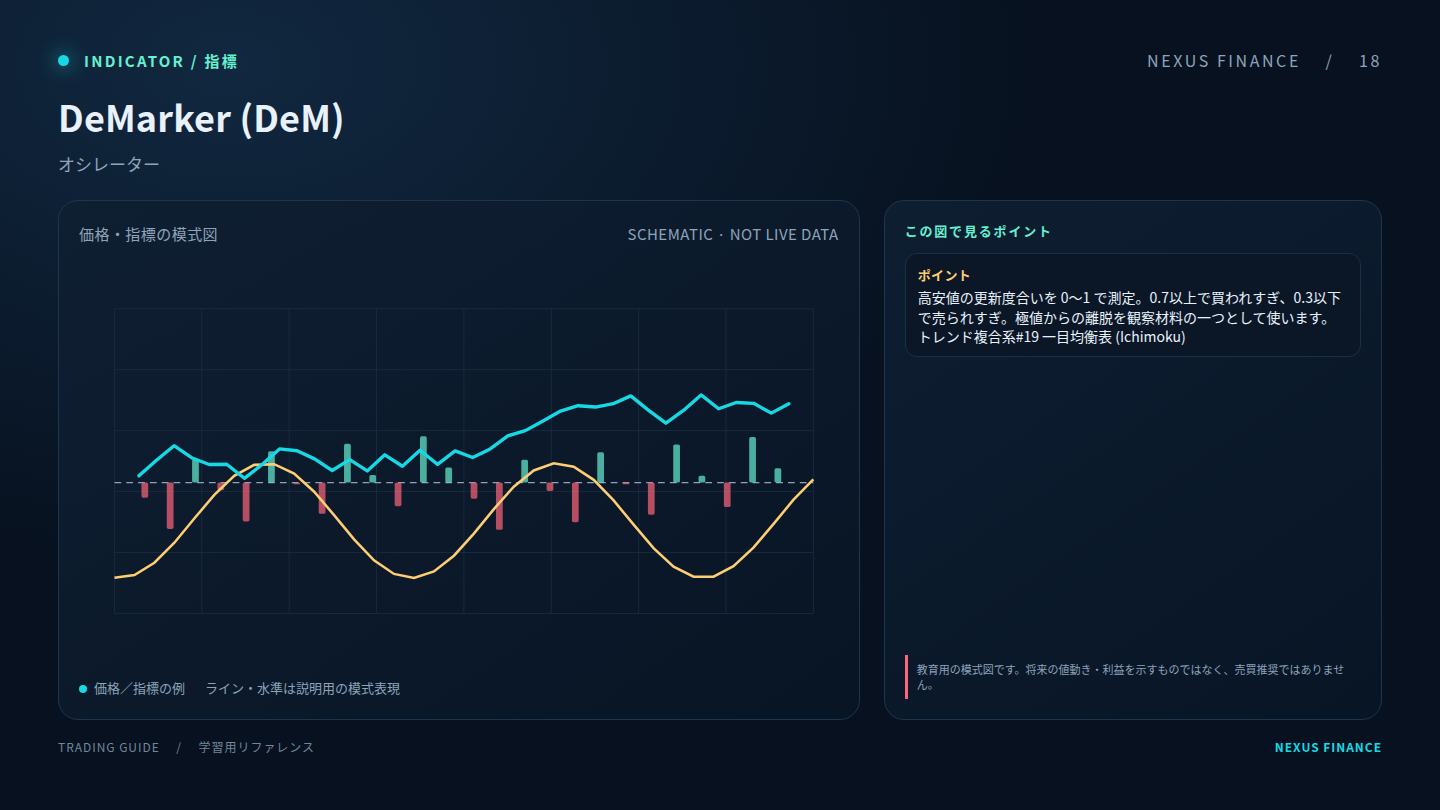 18 · Momentum
Tracks the pace or direction of price movement; overbought/oversold readings can persist during strong trends.
Reference term: DeMarker (DeM)
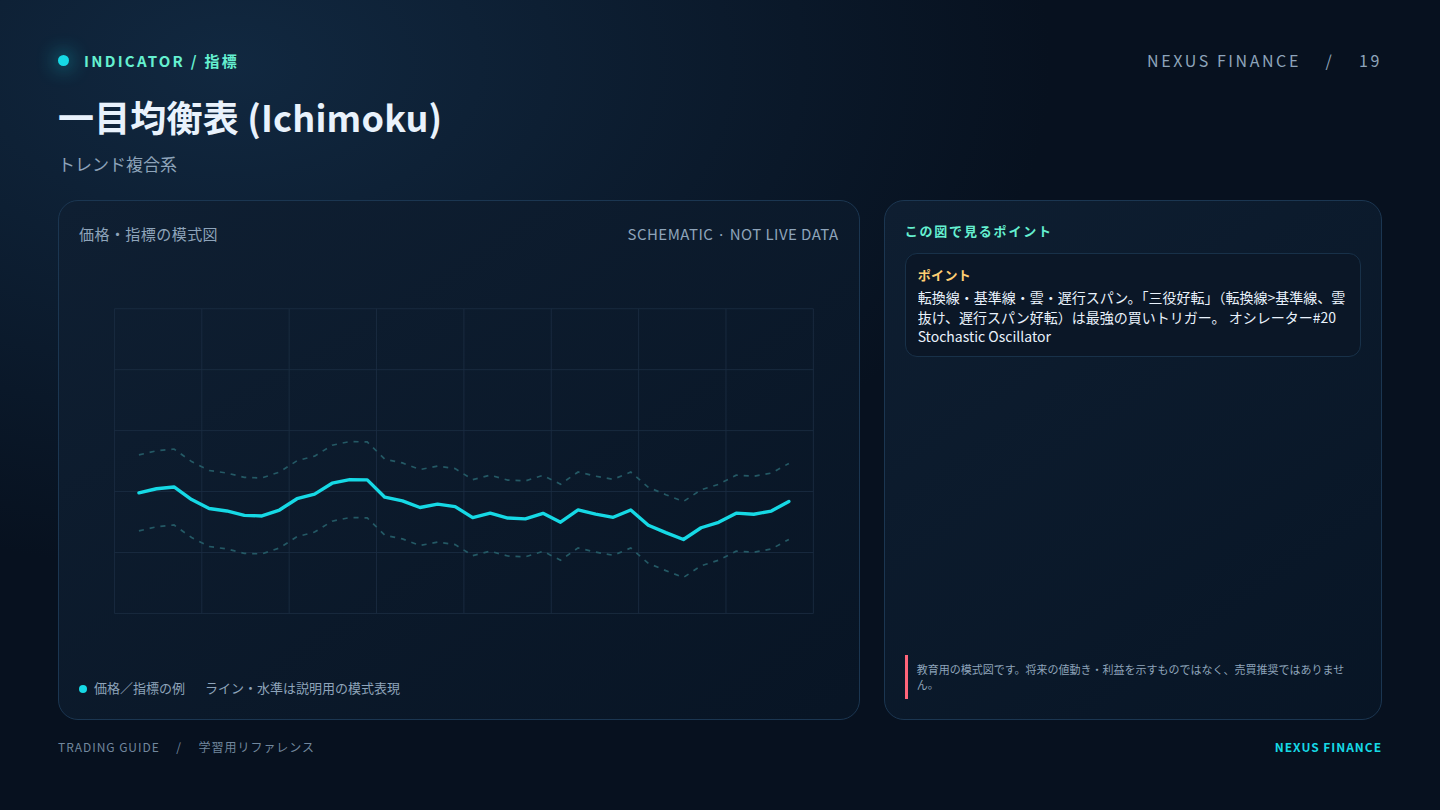 19 · Trend
Helps describe direction or trend strength. Confirm the signal with market structure and a defined exit rule.
Reference term: Ichimoku Cloud
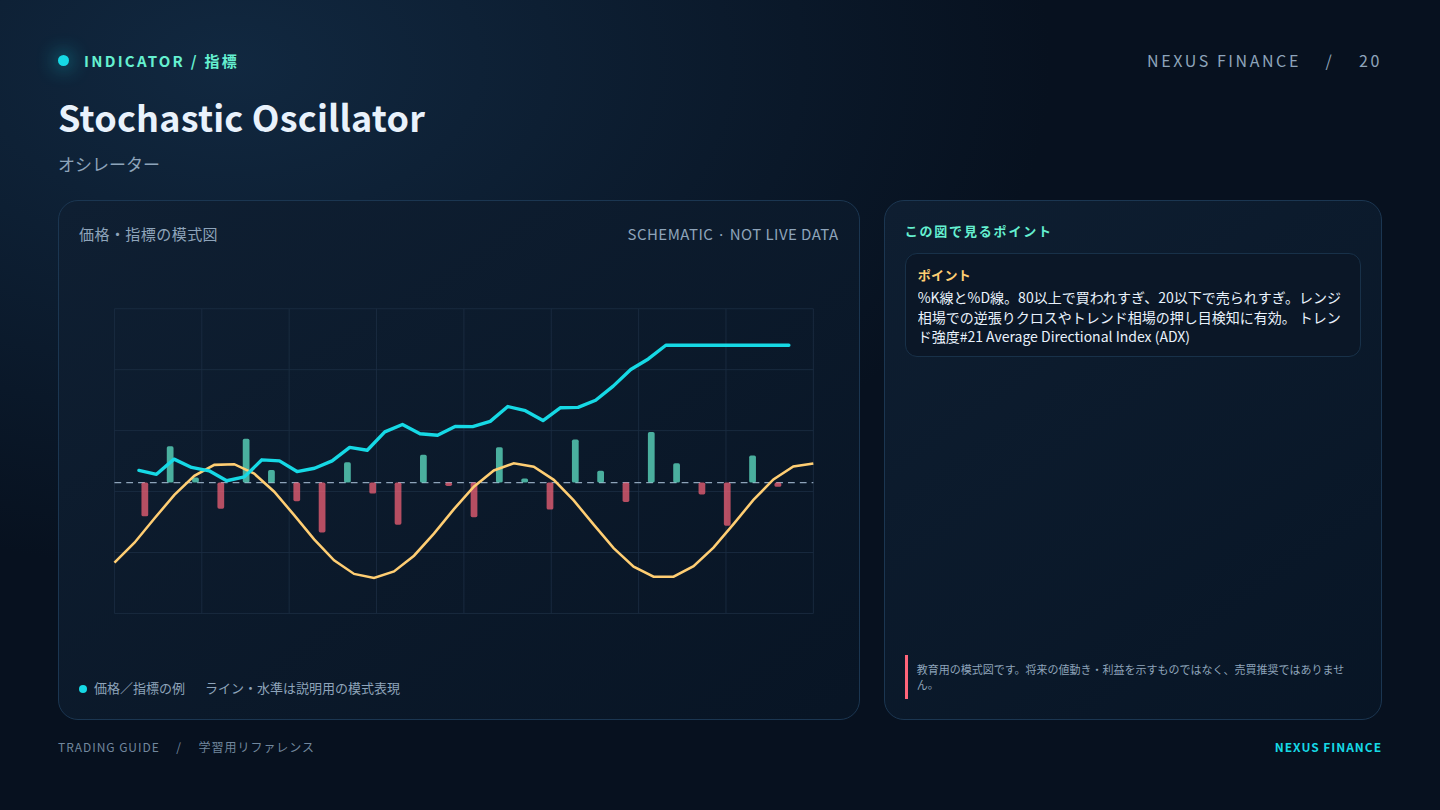 20 · Momentum
Tracks the pace or direction of price movement; overbought/oversold readings can persist during strong trends.
Reference term: Stochastic Oscillator
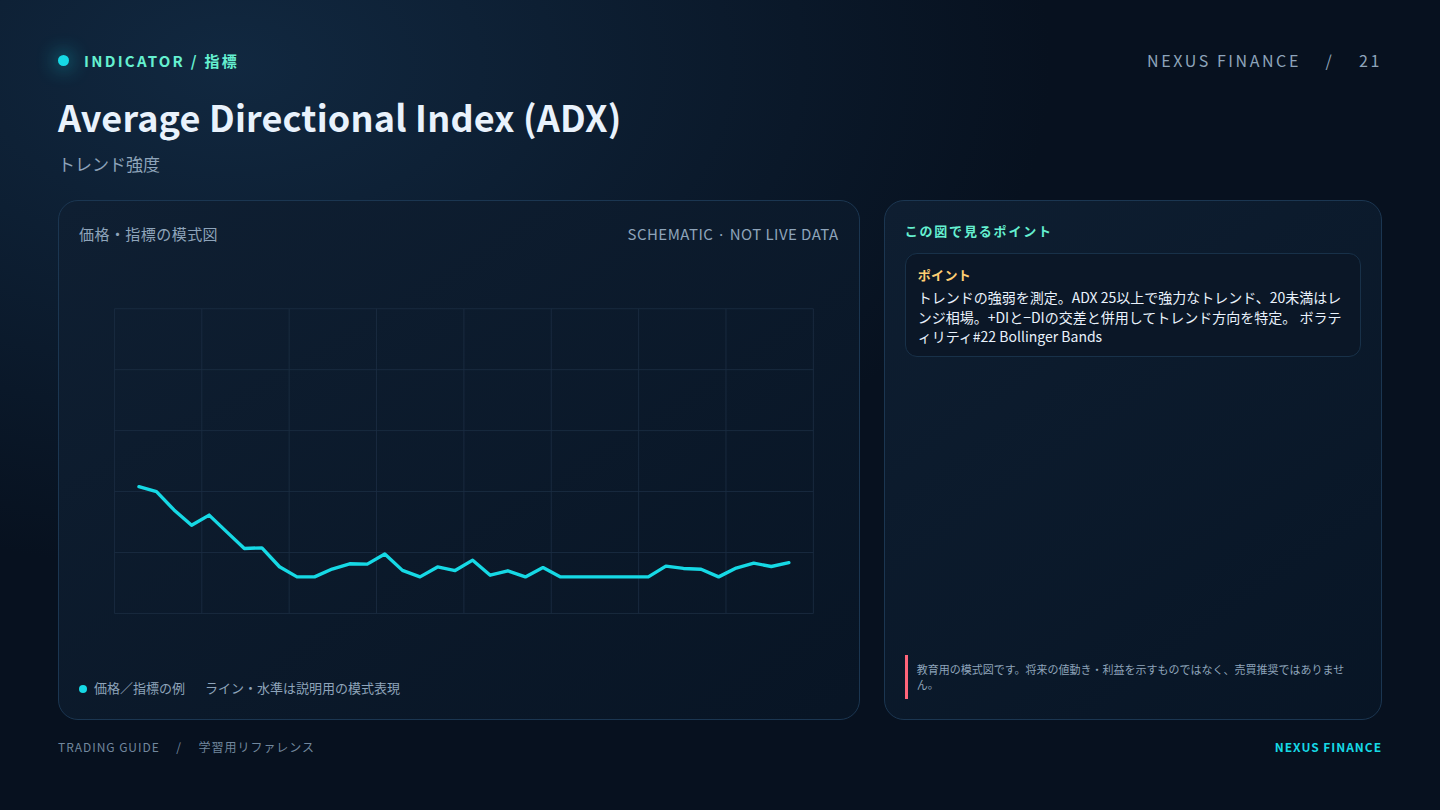 21 · Trend
Helps describe direction or trend strength. Confirm the signal with market structure and a defined exit rule.
Reference term: Average Directional Index (ADX)
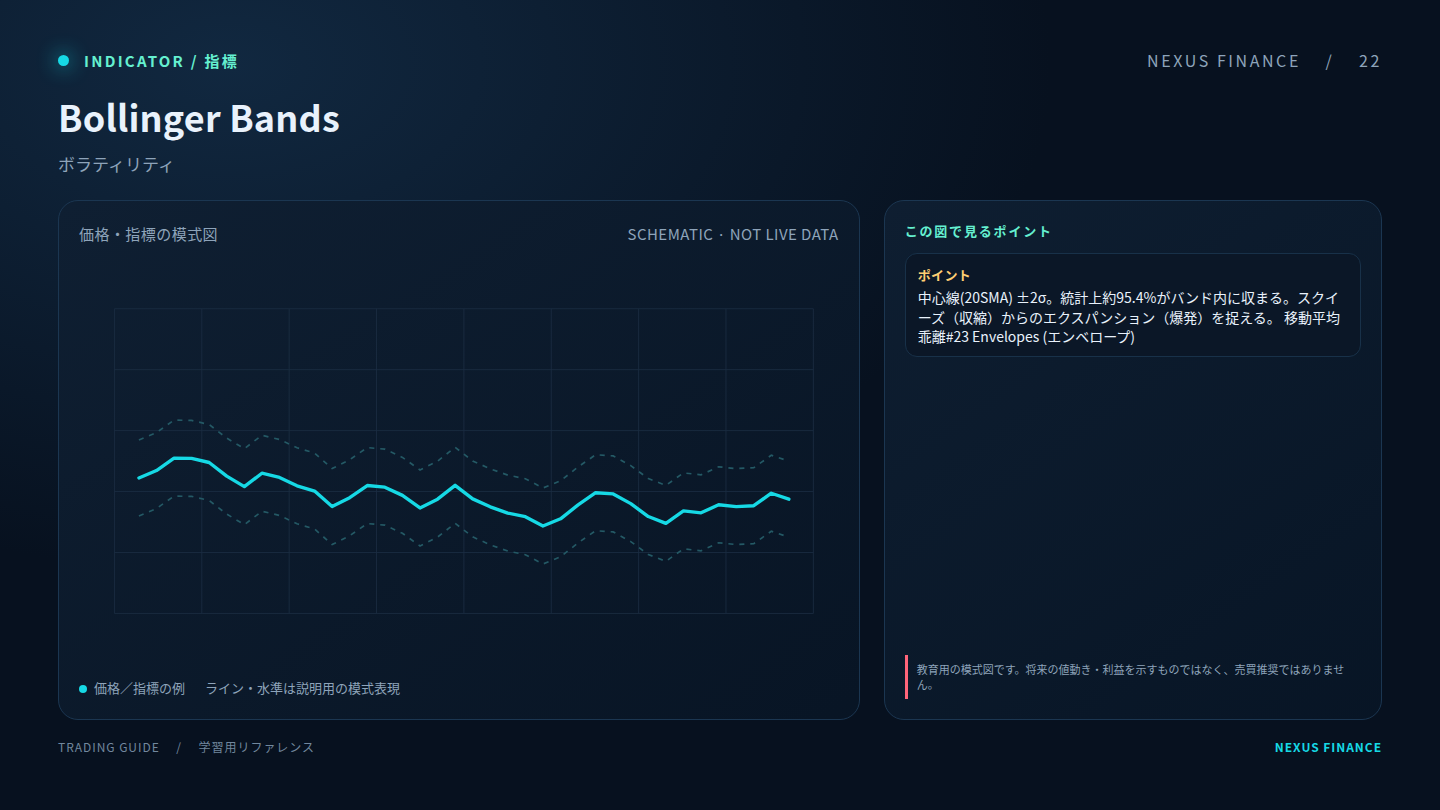 22 · Volatility
Summarizes range or variability. Volatility measures do not predict direction by themselves.
Reference term: Bollinger Bands
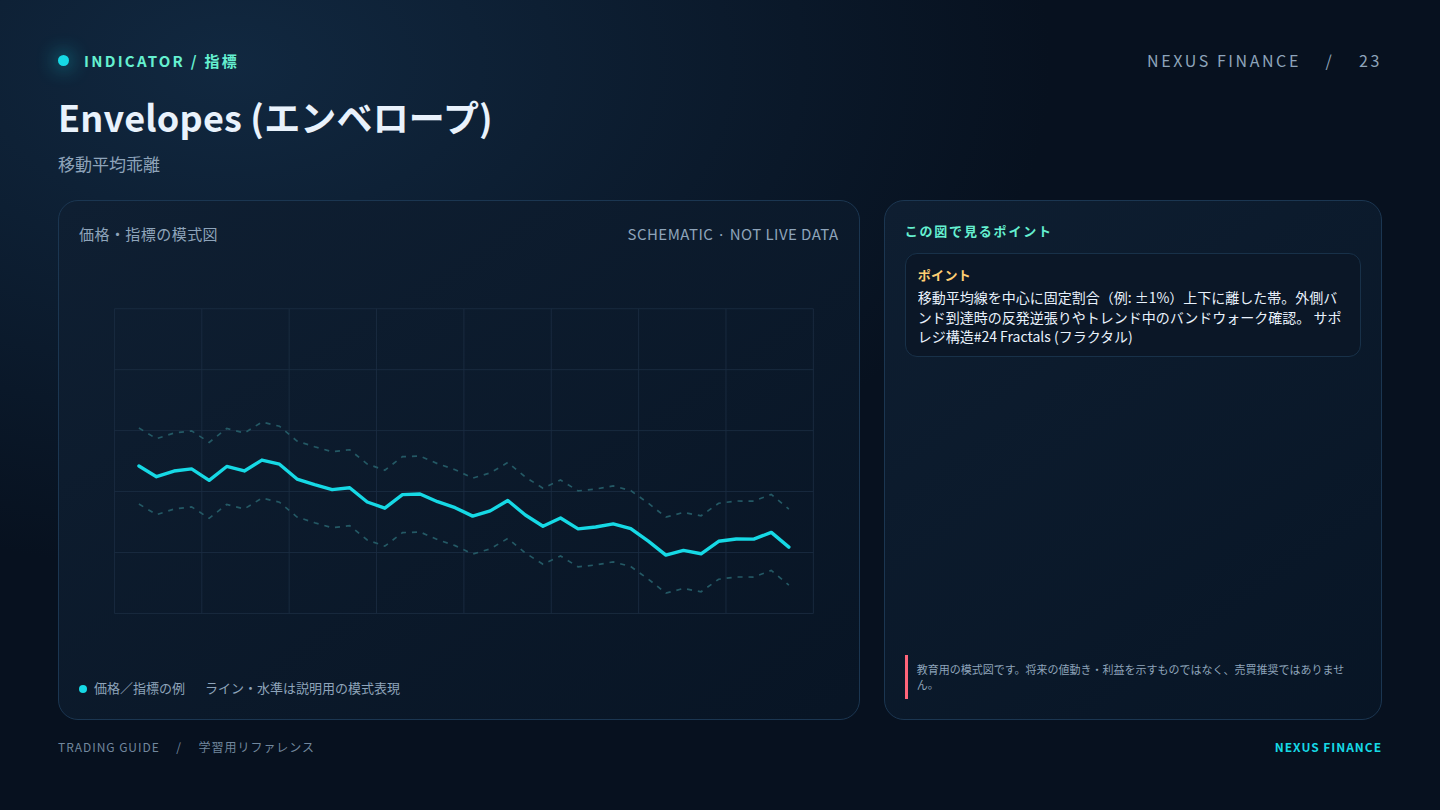 23 · Volatility
Summarizes range or variability. Volatility measures do not predict direction by themselves.
Reference term: Envelopes
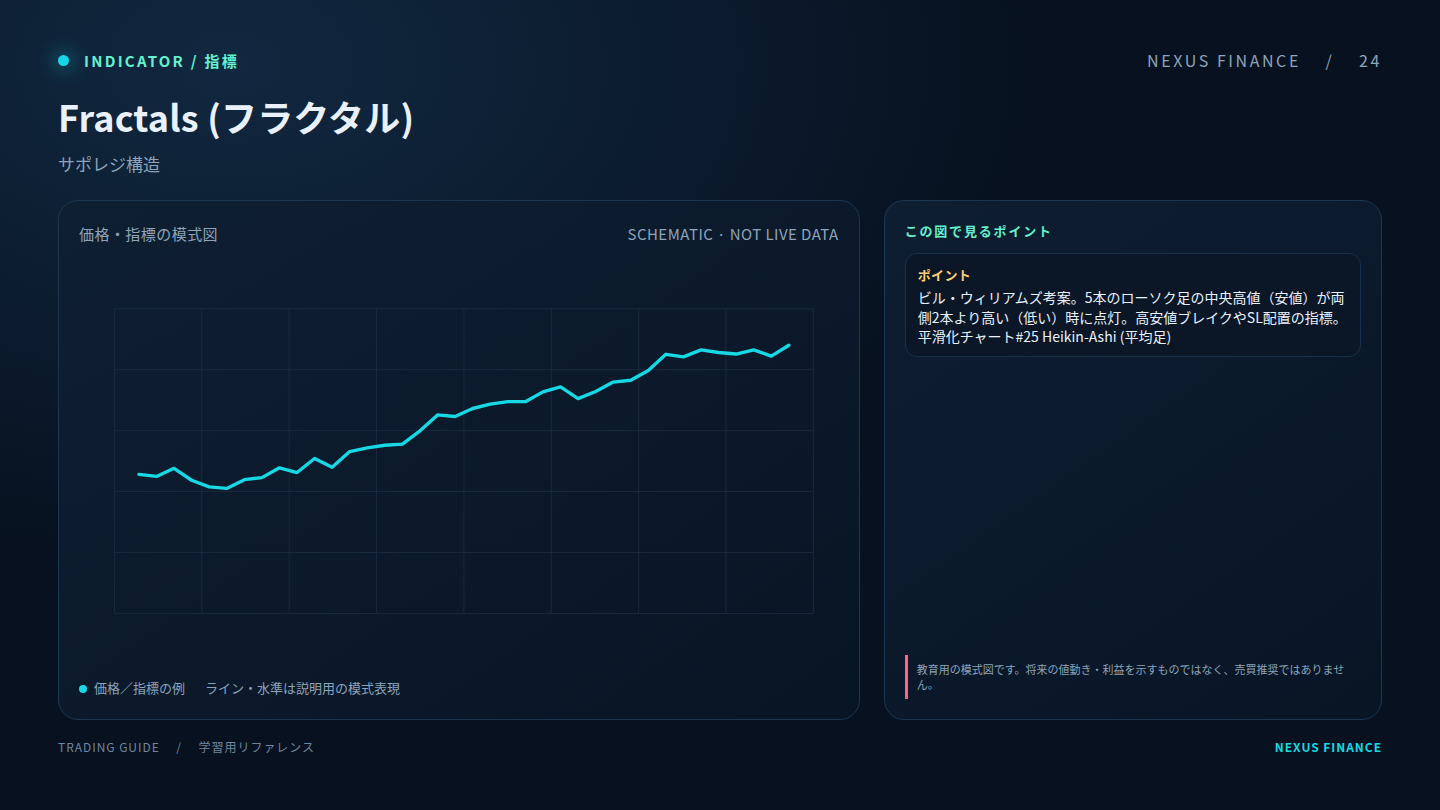 24 · Structure
Simplifies swings or candle presentation to help read structure; settings can change what becomes visible.
Reference term: Fractals
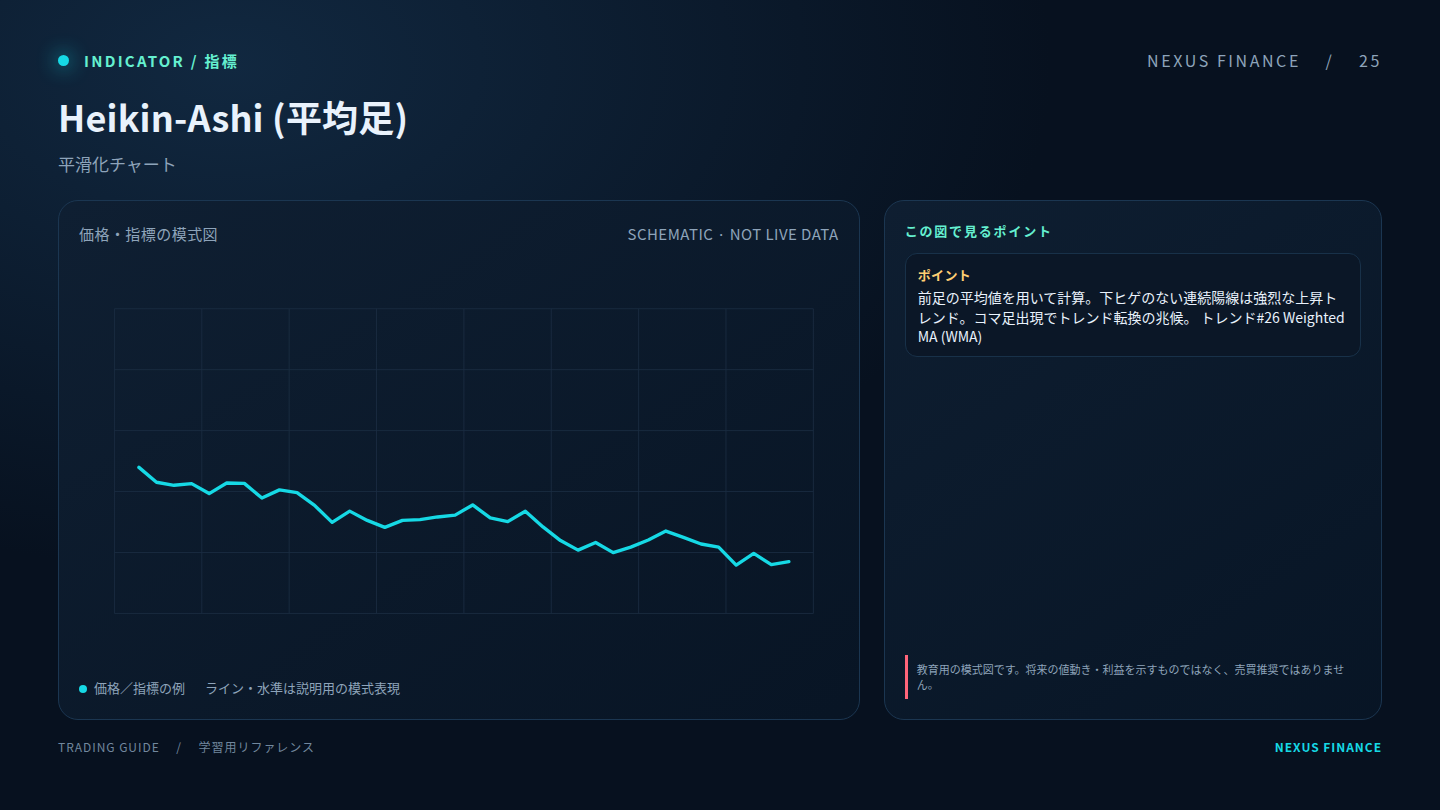 25 · Structure
Simplifies swings or candle presentation to help read structure; settings can change what becomes visible.
Reference term: Heikin-Ashi
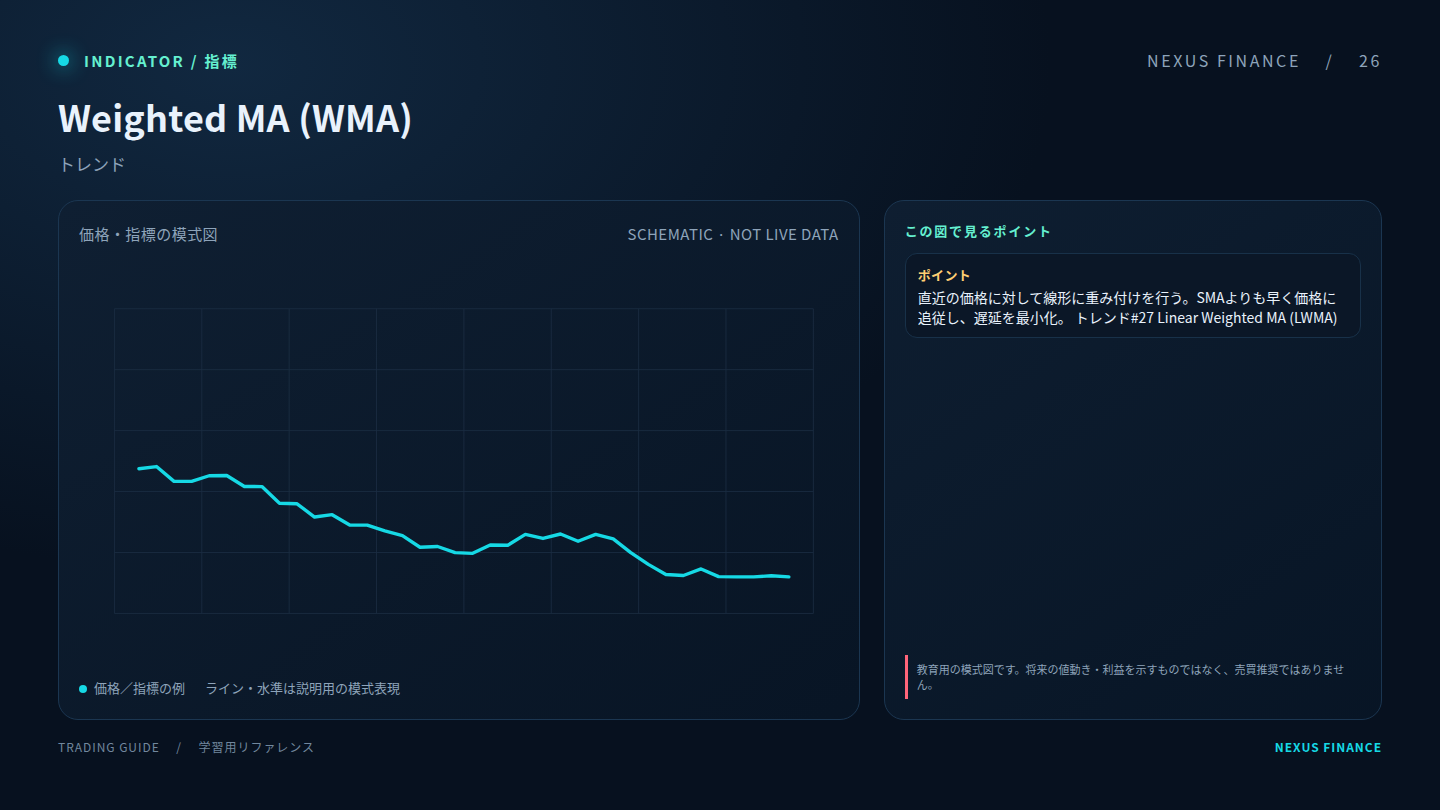 26 · Trend
Helps describe direction or trend strength. Confirm the signal with market structure and a defined exit rule.
Reference term: Weighted MA (WMA)
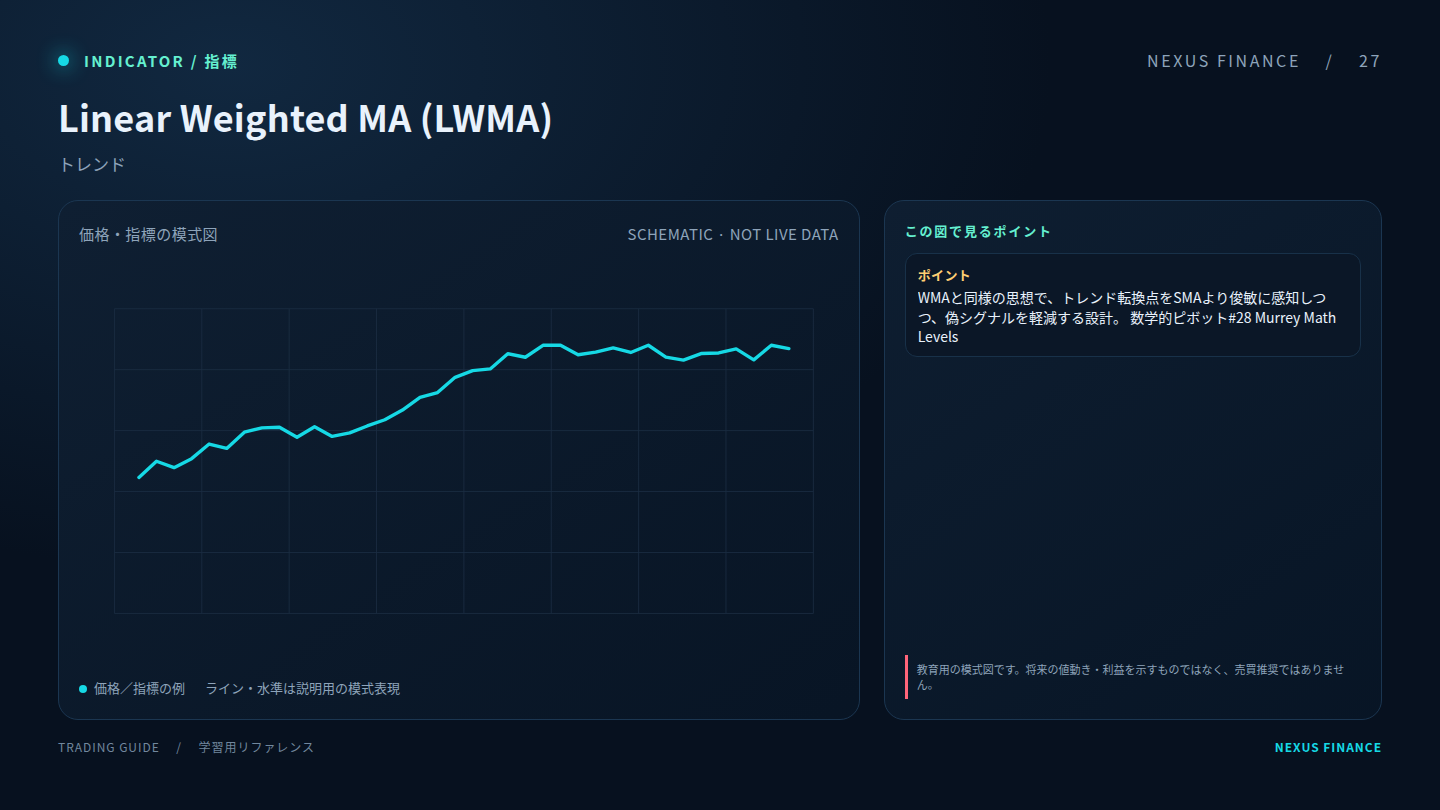 27 · Trend
Helps describe direction or trend strength. Confirm the signal with market structure and a defined exit rule.
Reference term: Linear Weighted MA (LWMA)
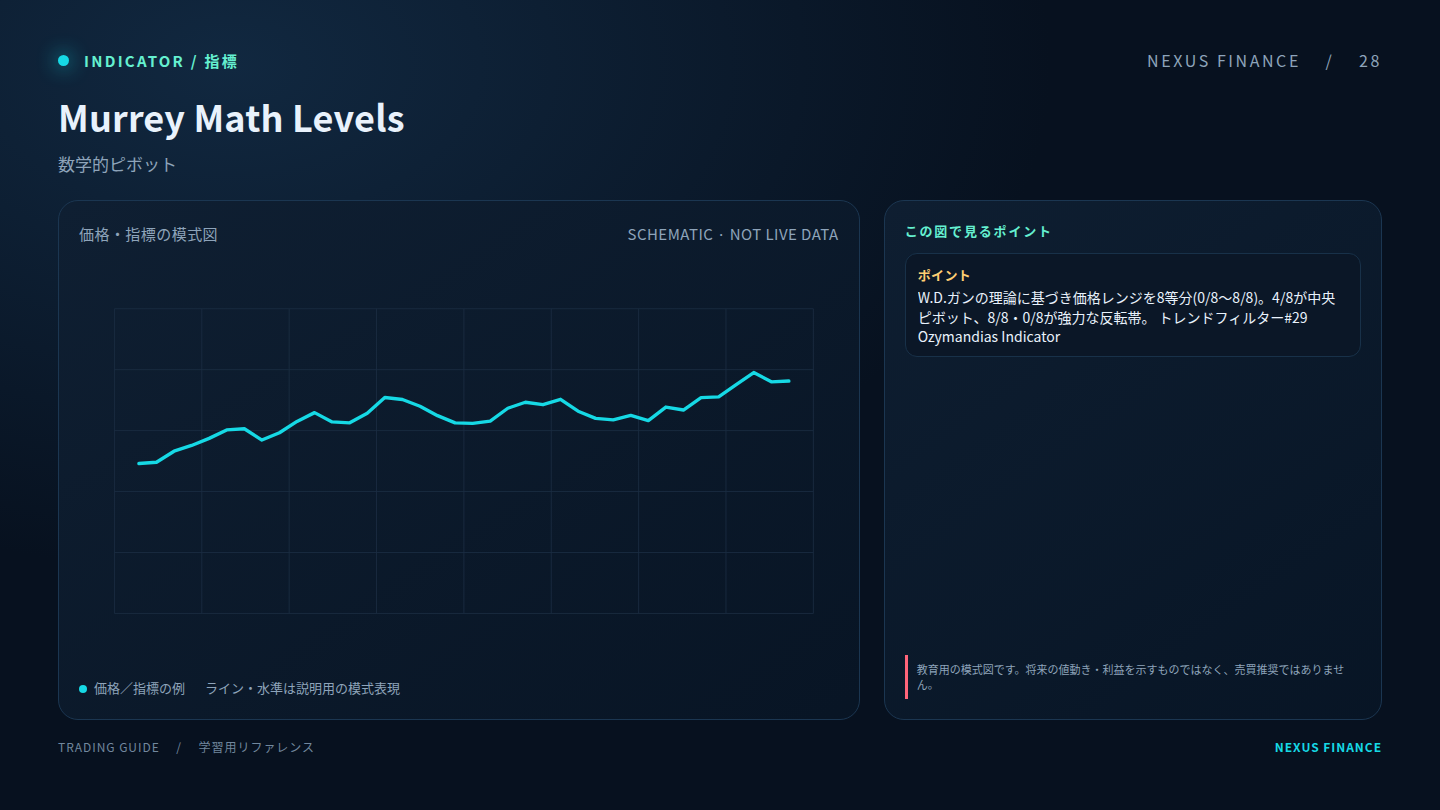 28 · Levels
Provides reference levels rather than guaranteed reversal prices; validate reactions and define invalidation.
Reference term: Murrey Math Levels
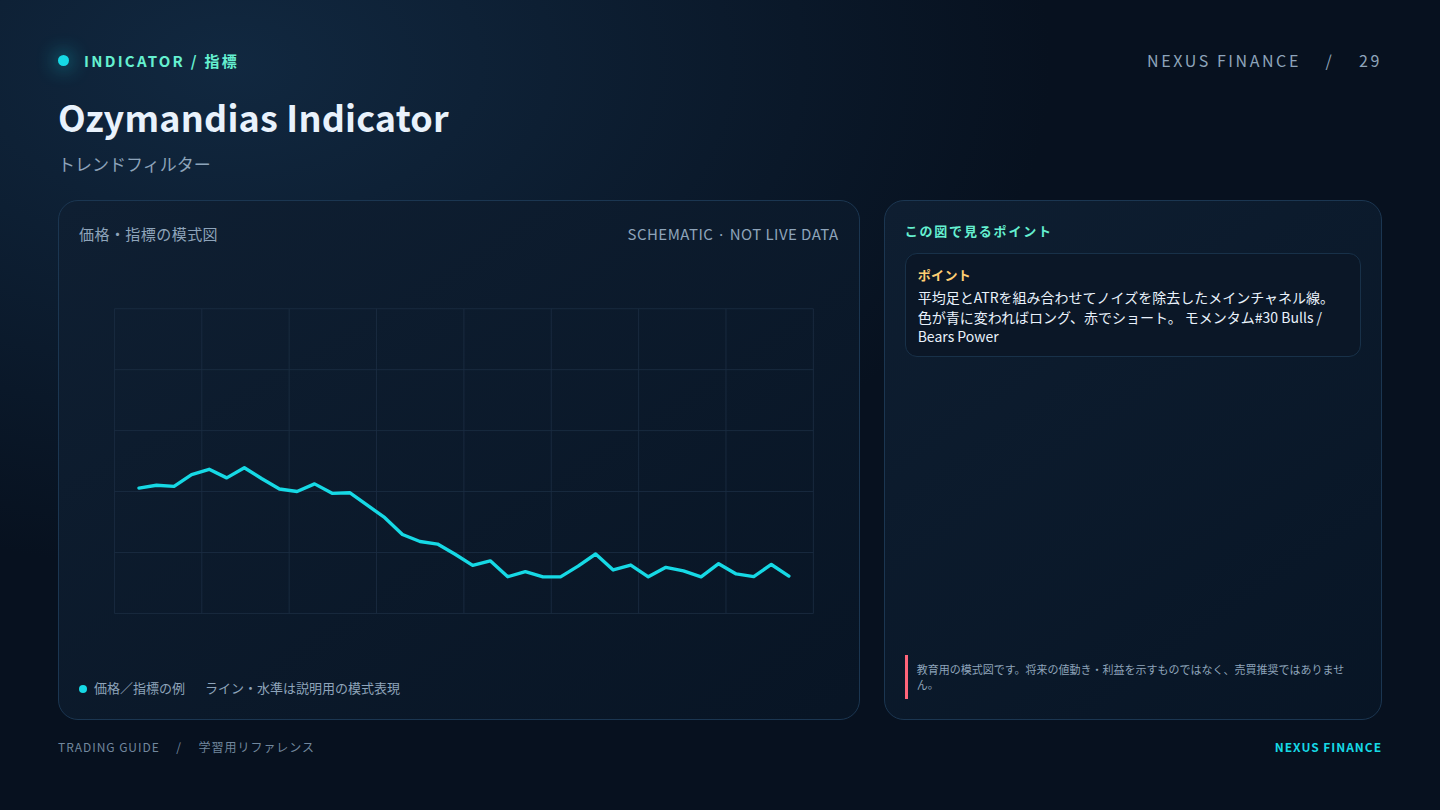 29 · Trend
Helps describe direction or trend strength. Confirm the signal with market structure and a defined exit rule.
Reference term: Ozymandias Indicator
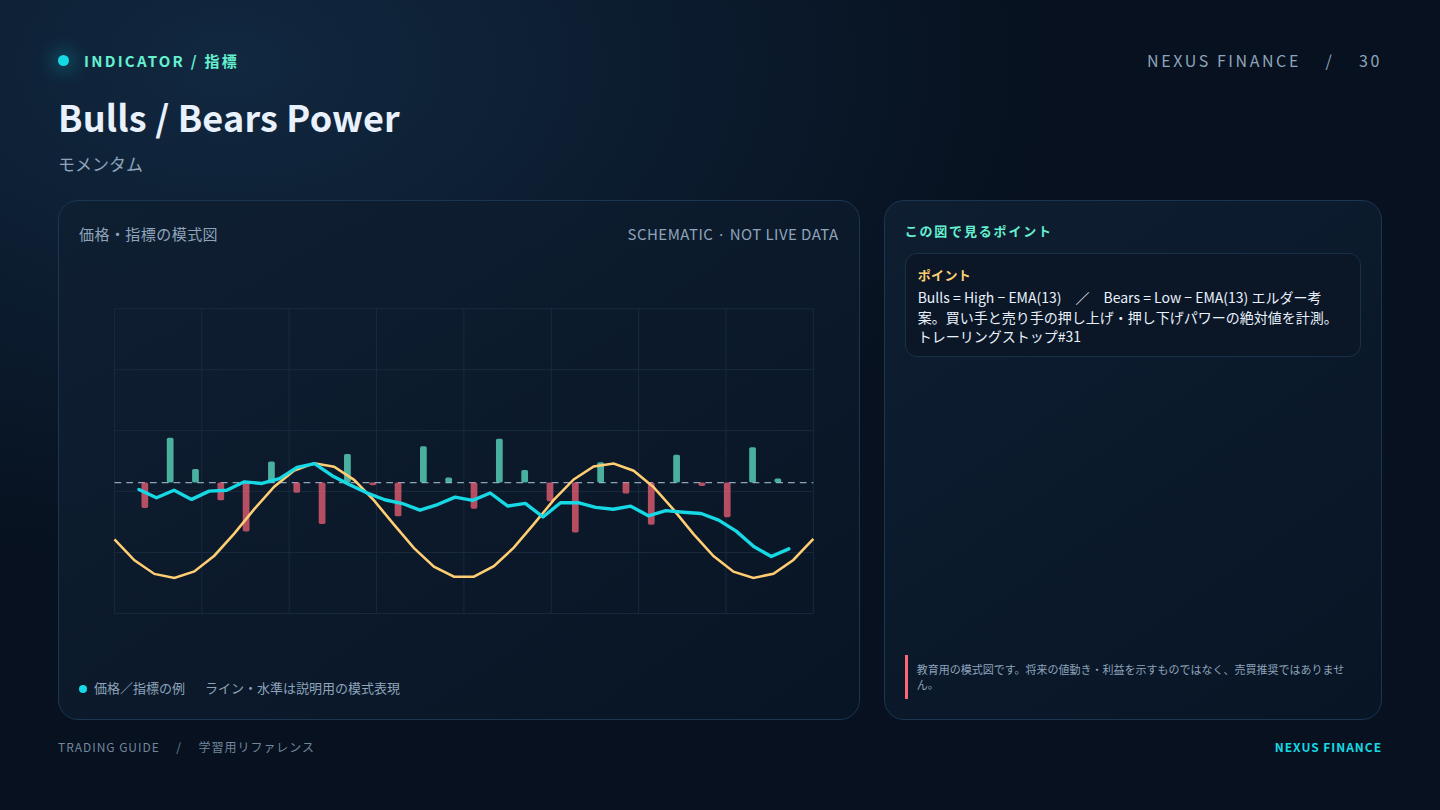 30 · Momentum
Tracks the pace or direction of price movement; overbought/oversold readings can persist during strong trends.
Reference term: Bulls / Bears Power
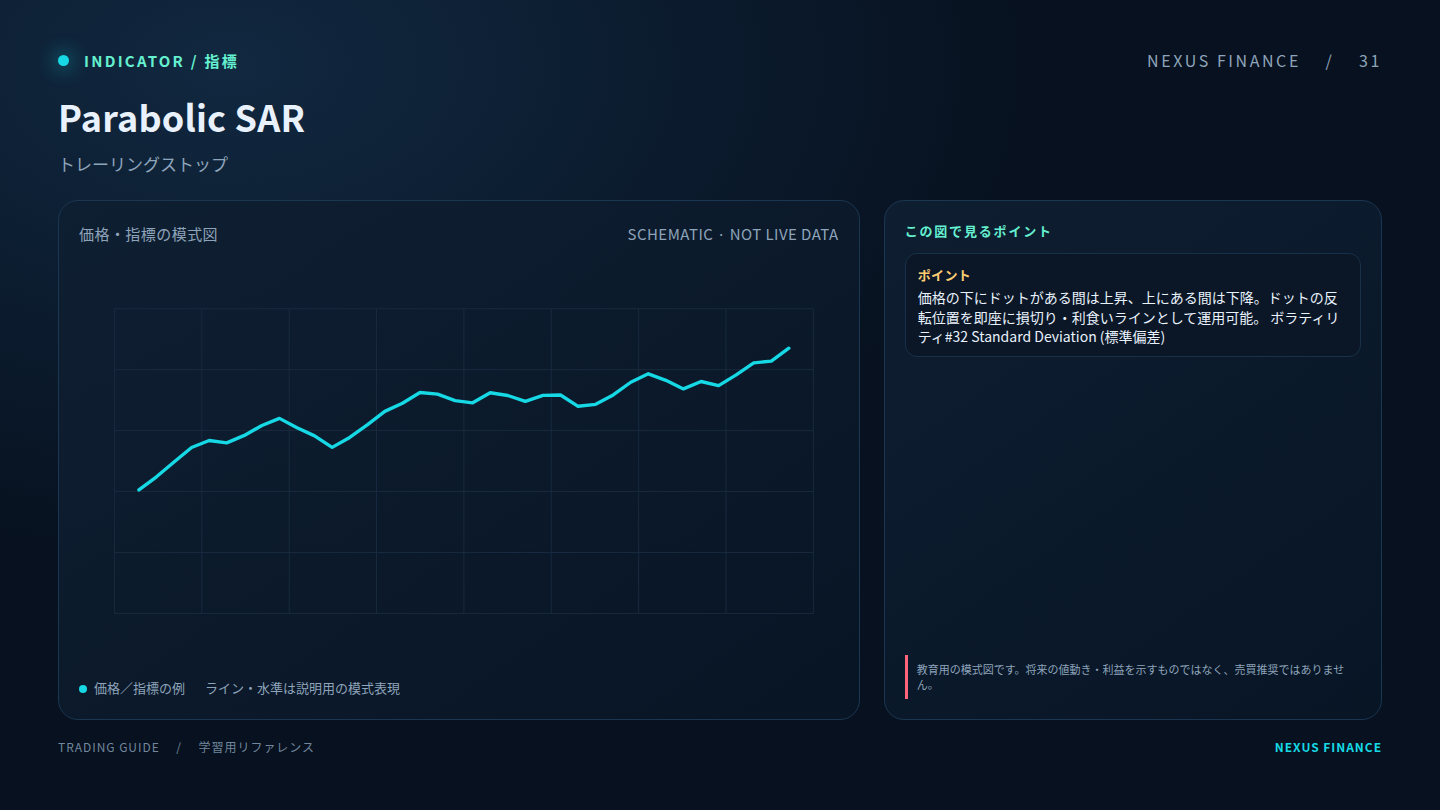 31 · Trend
Helps describe direction or trend strength. Confirm the signal with market structure and a defined exit rule.
Reference term: Parabolic SAR
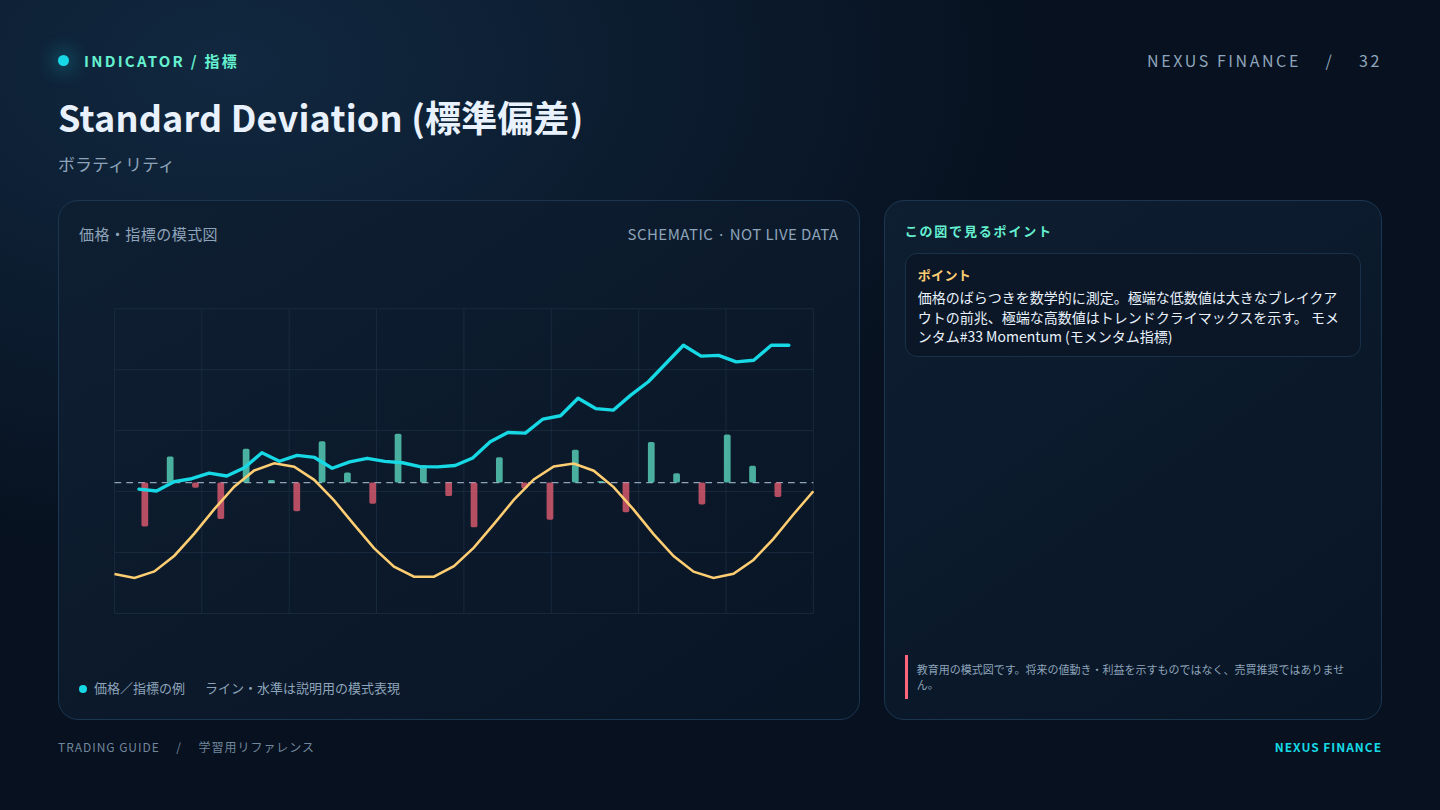 32 · Volatility
Summarizes range or variability. Volatility measures do not predict direction by themselves.
Reference term: Standard Deviation
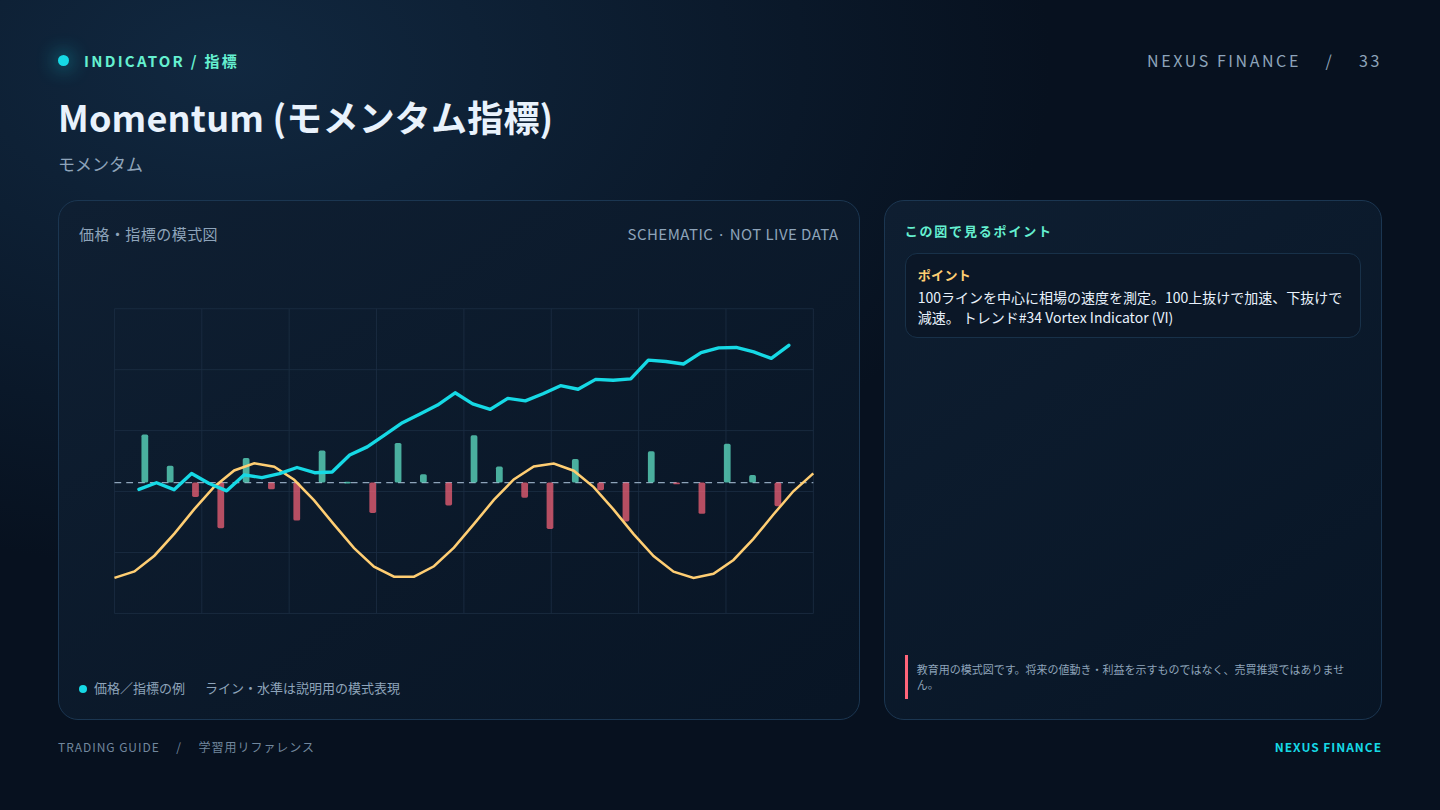 33 · Momentum
Tracks the pace or direction of price movement; overbought/oversold readings can persist during strong trends.
Reference term: Momentum
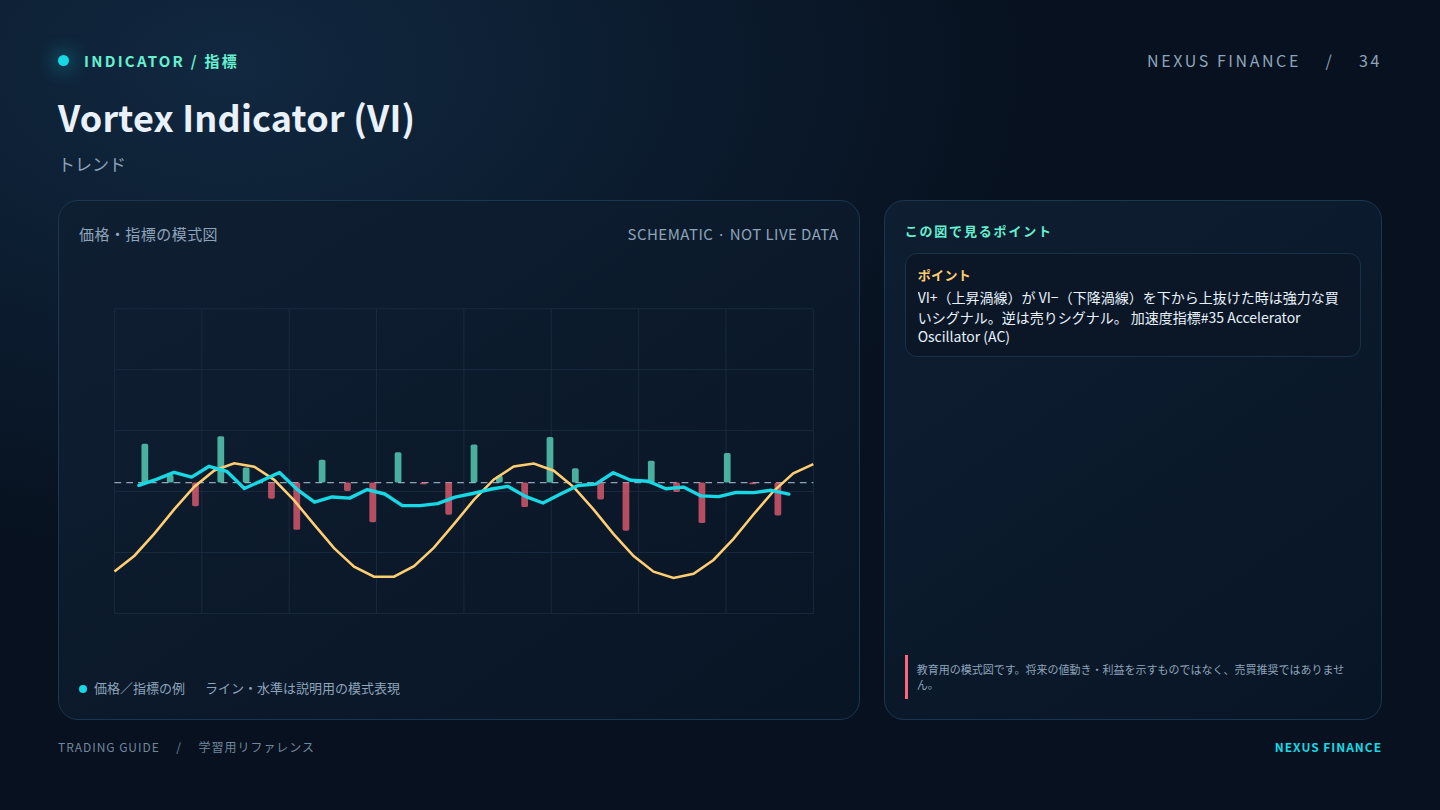 34 · Trend
Helps describe direction or trend strength. Confirm the signal with market structure and a defined exit rule.
Reference term: Vortex Indicator (VI)
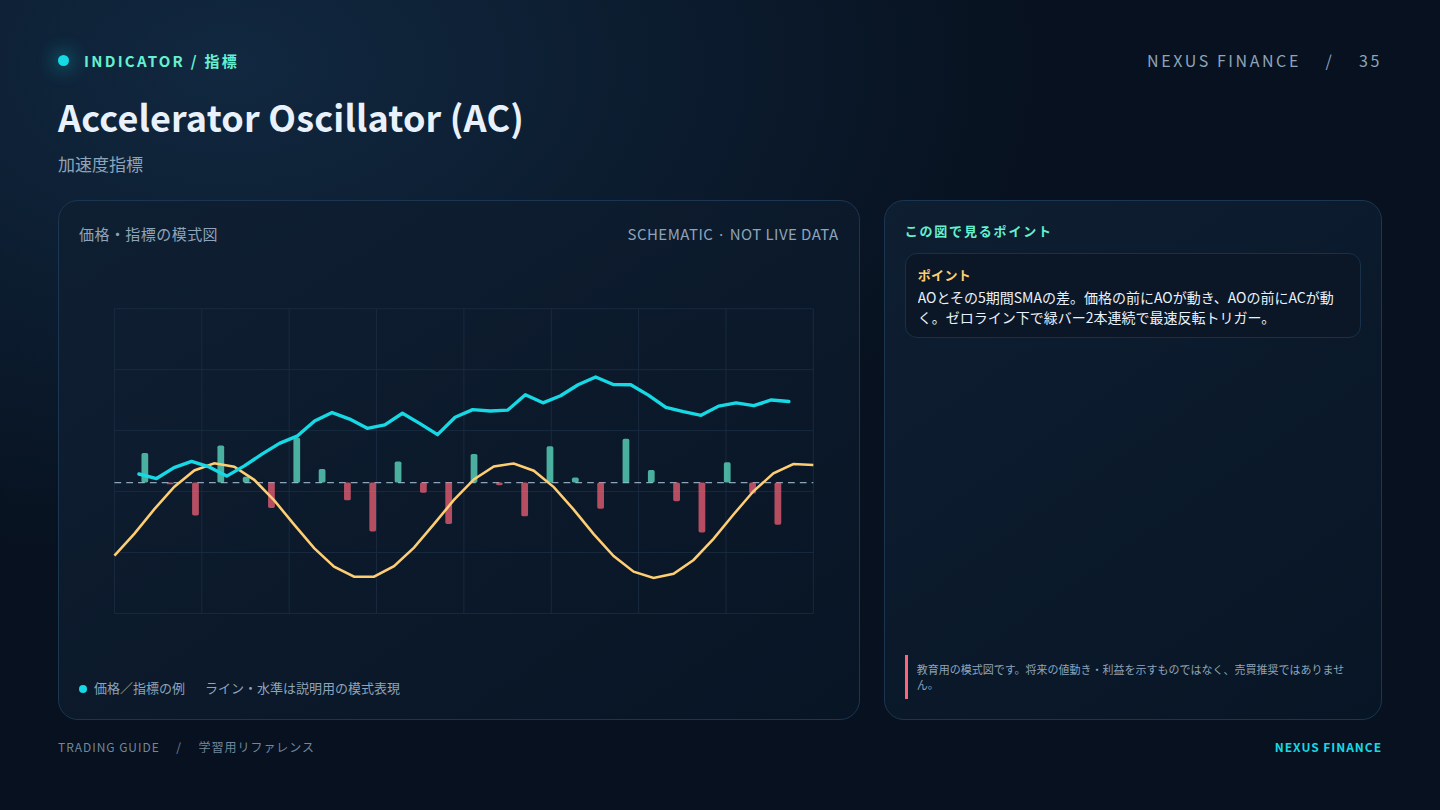 35 · Momentum
Tracks the pace or direction of price movement; overbought/oversold readings can persist during strong trends.
Reference term: Accelerator Oscillator (AC)
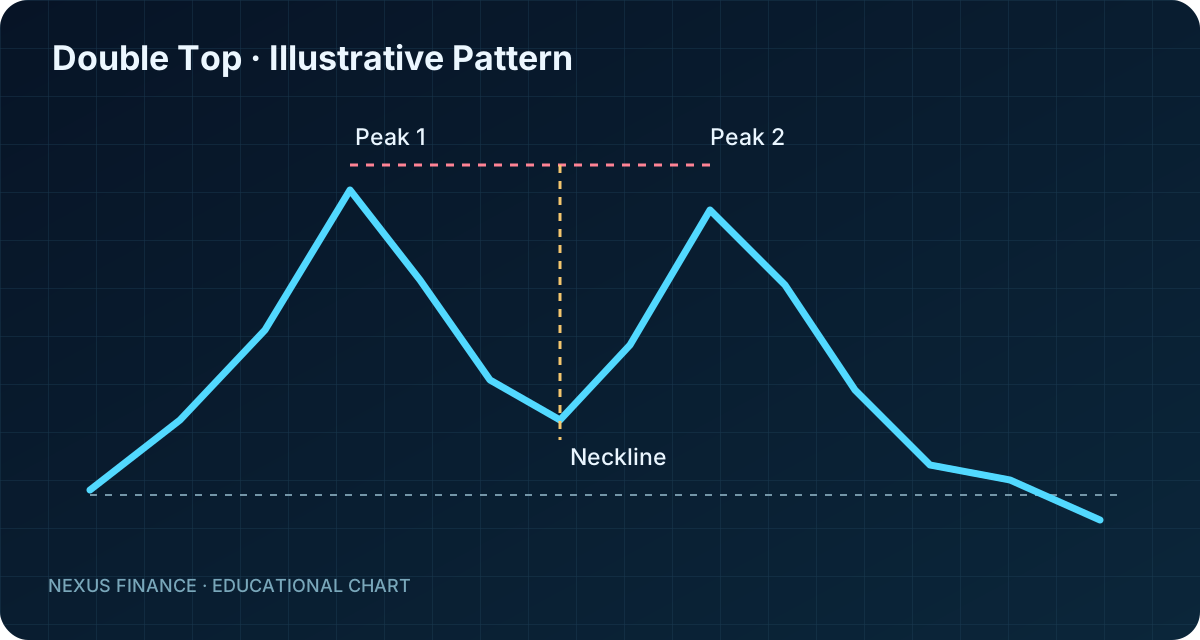
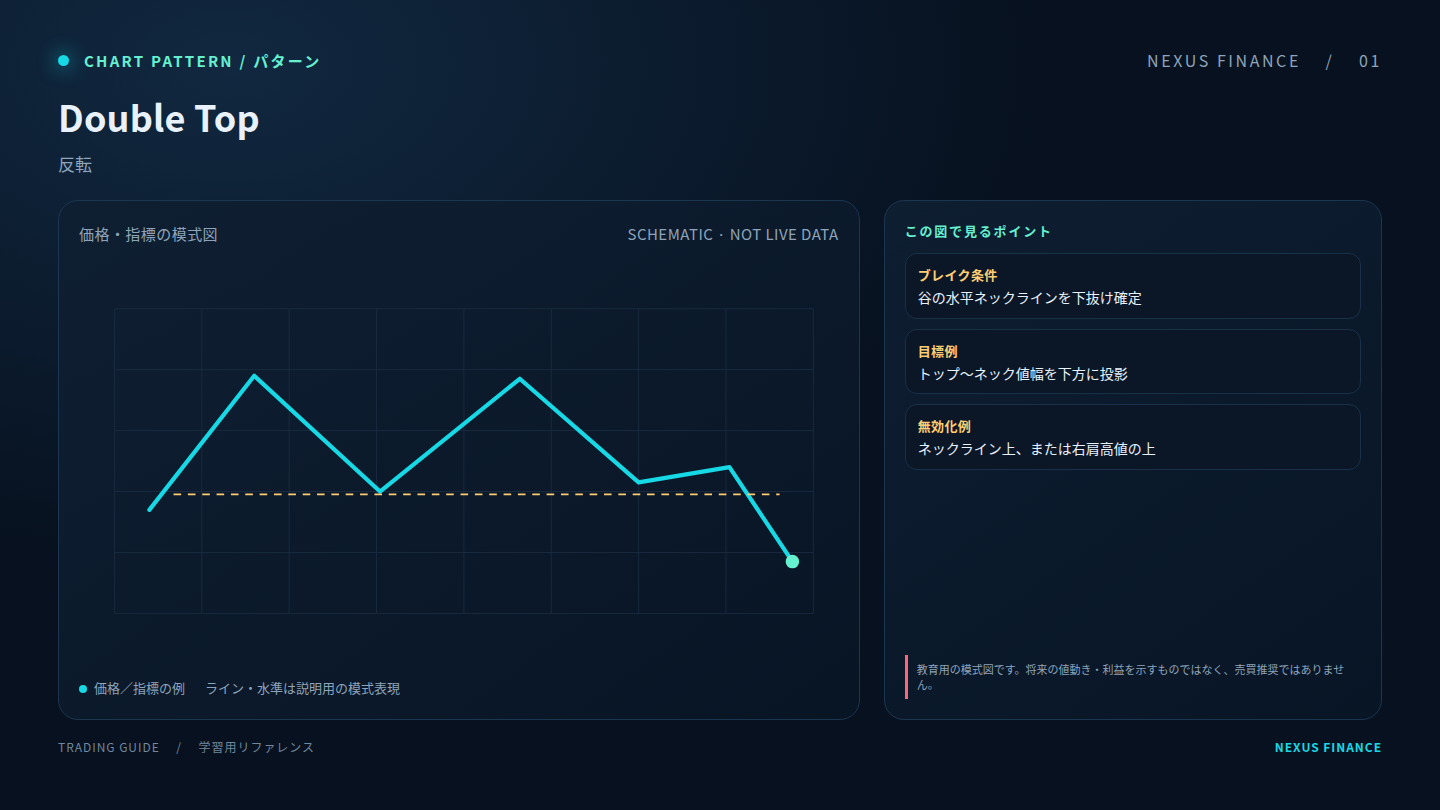 01
01Double Top
A possible turning-point structure. Wait for a confirmed break, close or retest and define invalidation; a pattern can fail.
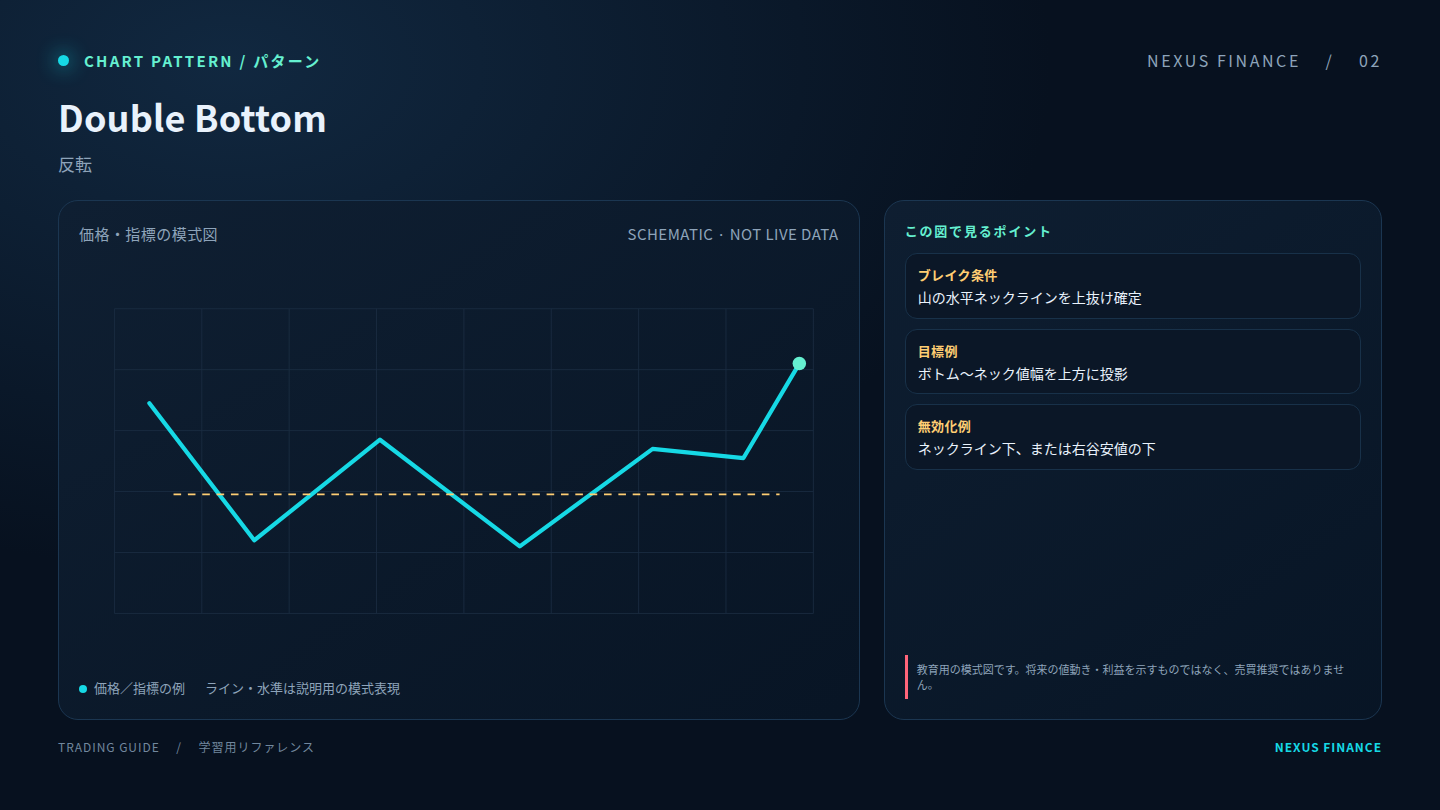 02
02Double Bottom
A possible turning-point structure. Wait for a confirmed break, close or retest and define invalidation; a pattern can fail.
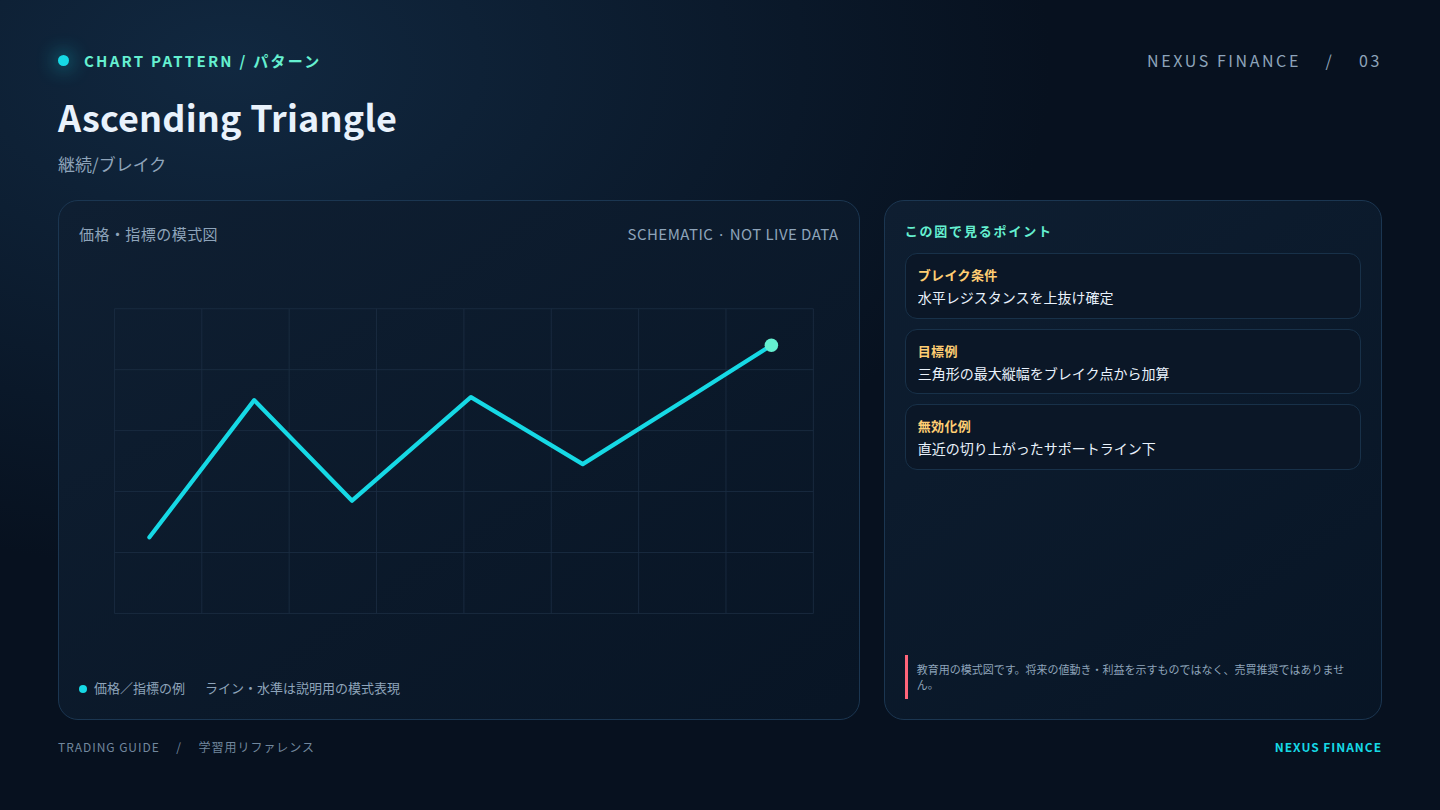 03
03Ascending Triangle
A possible consolidation or continuation structure. Breakouts can be false, so use a close/confirmation rule and planned risk.
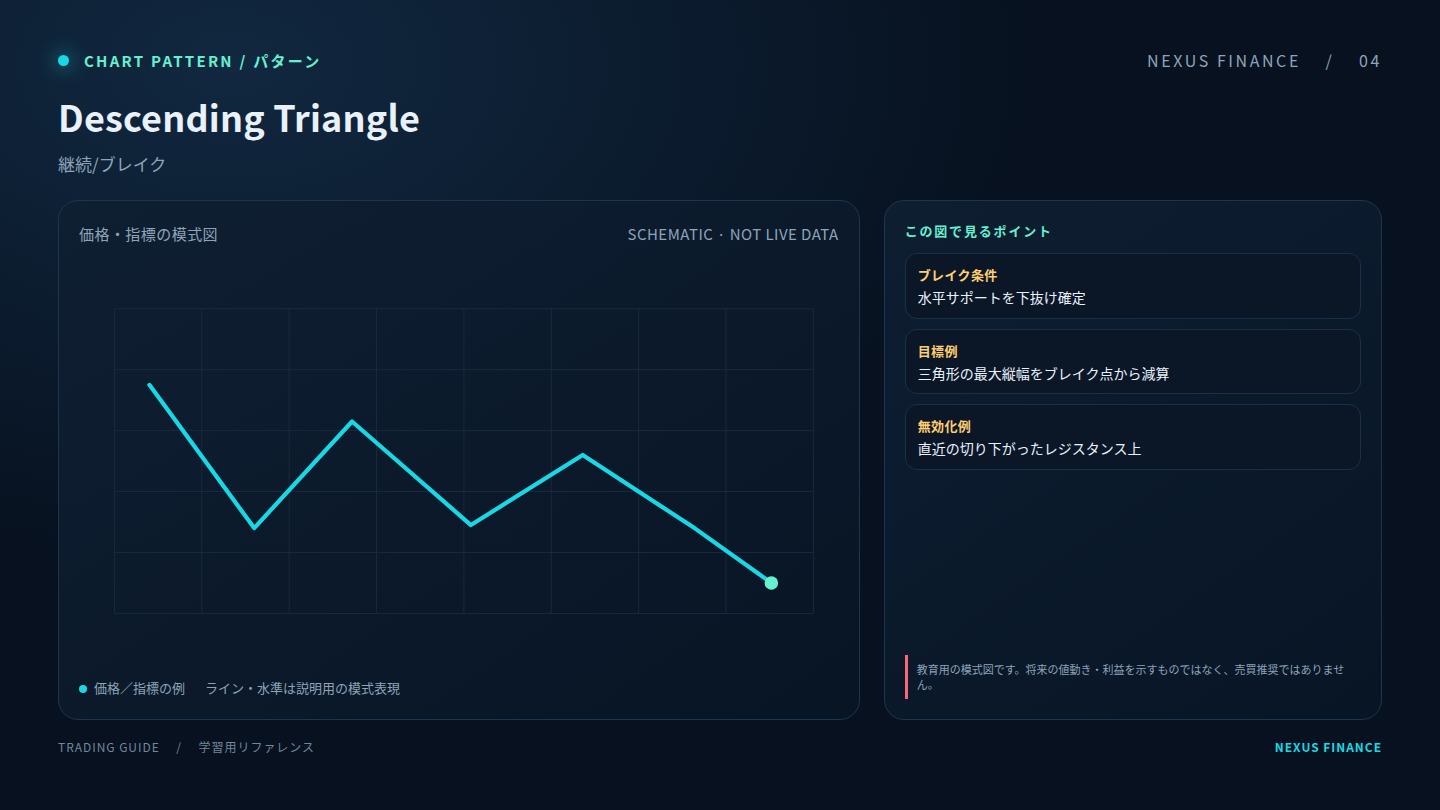 04
04Descending Triangle
A possible consolidation or continuation structure. Breakouts can be false, so use a close/confirmation rule and planned risk.
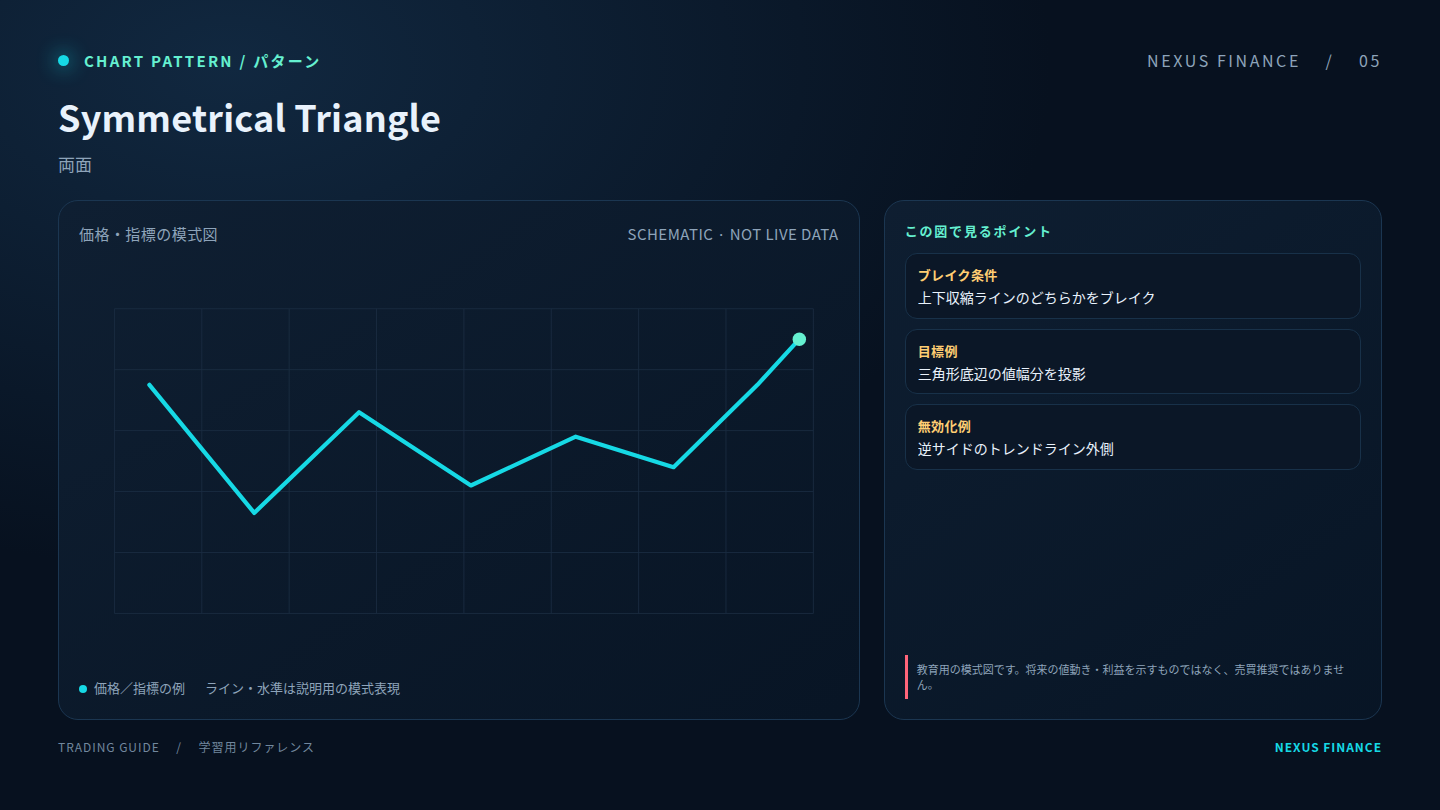 05
05Symmetrical Triangle
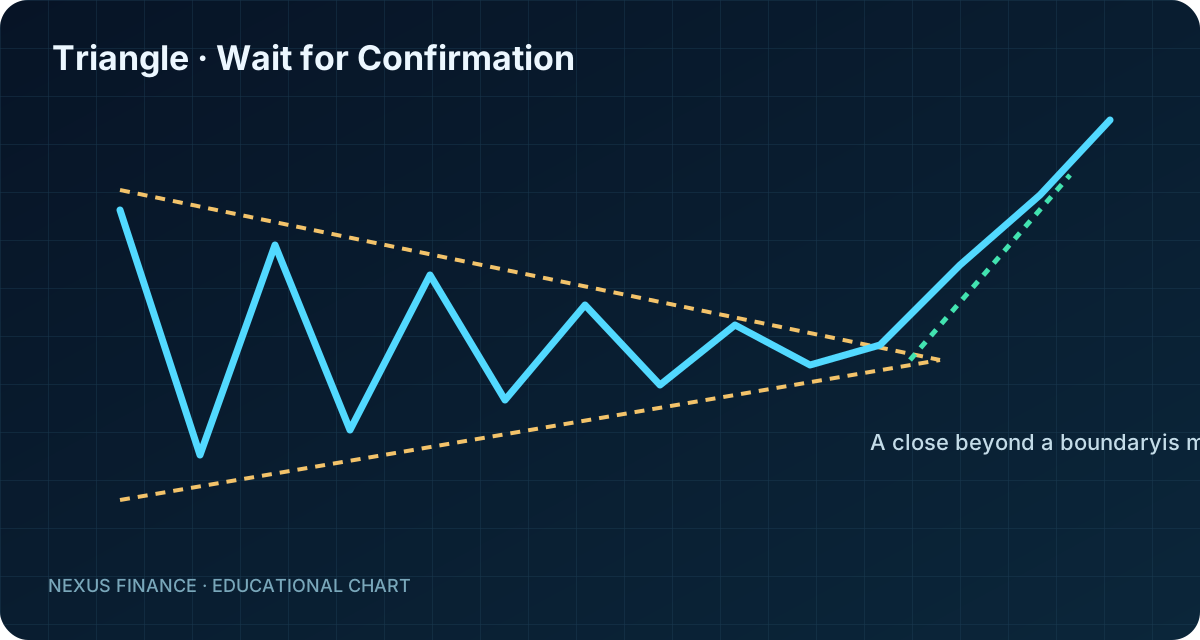
A possible consolidation or continuation structure. Breakouts can be false, so use a close/confirmation rule and planned risk.
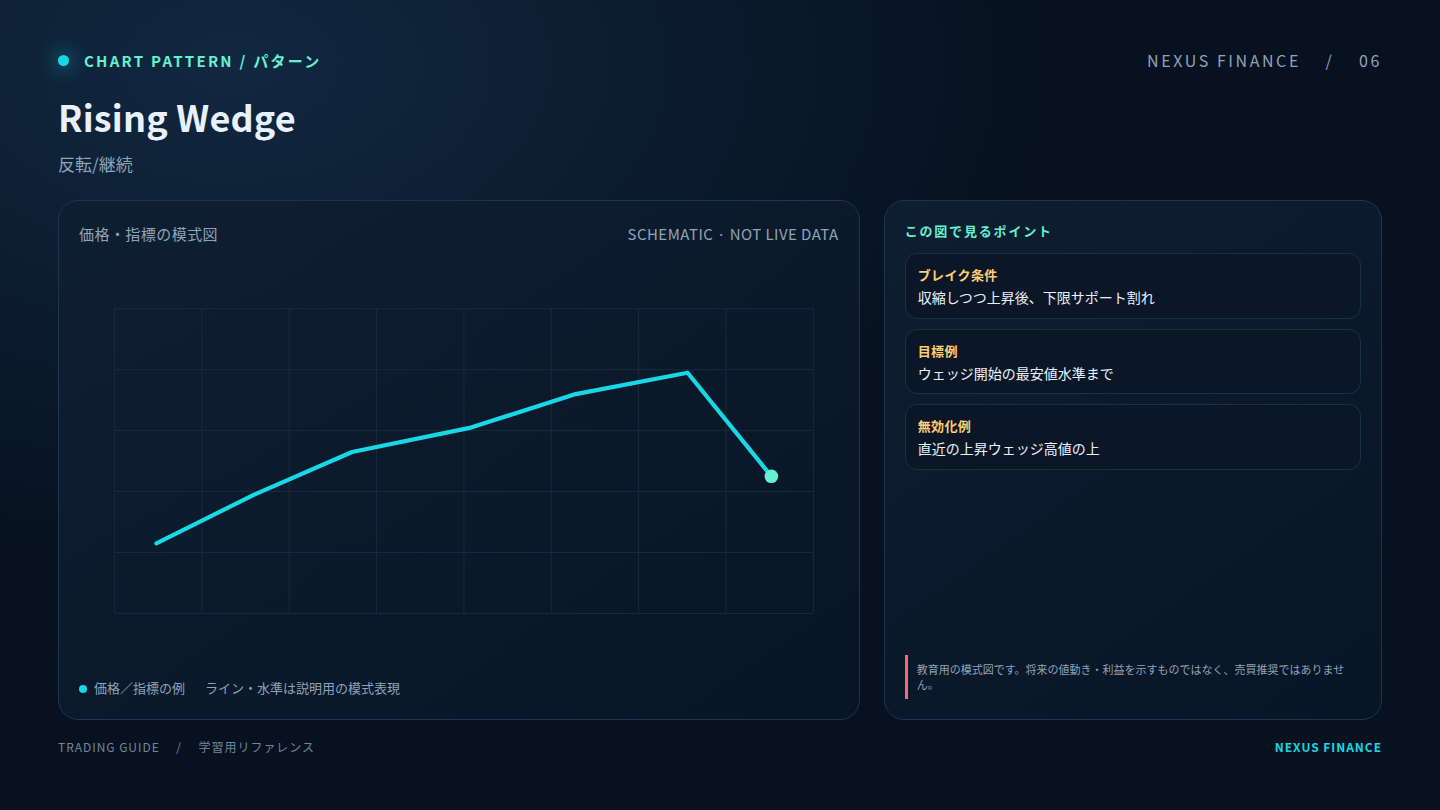 06
06Rising Wedge
A possible turning-point structure. Wait for a confirmed break, close or retest and define invalidation; a pattern can fail.
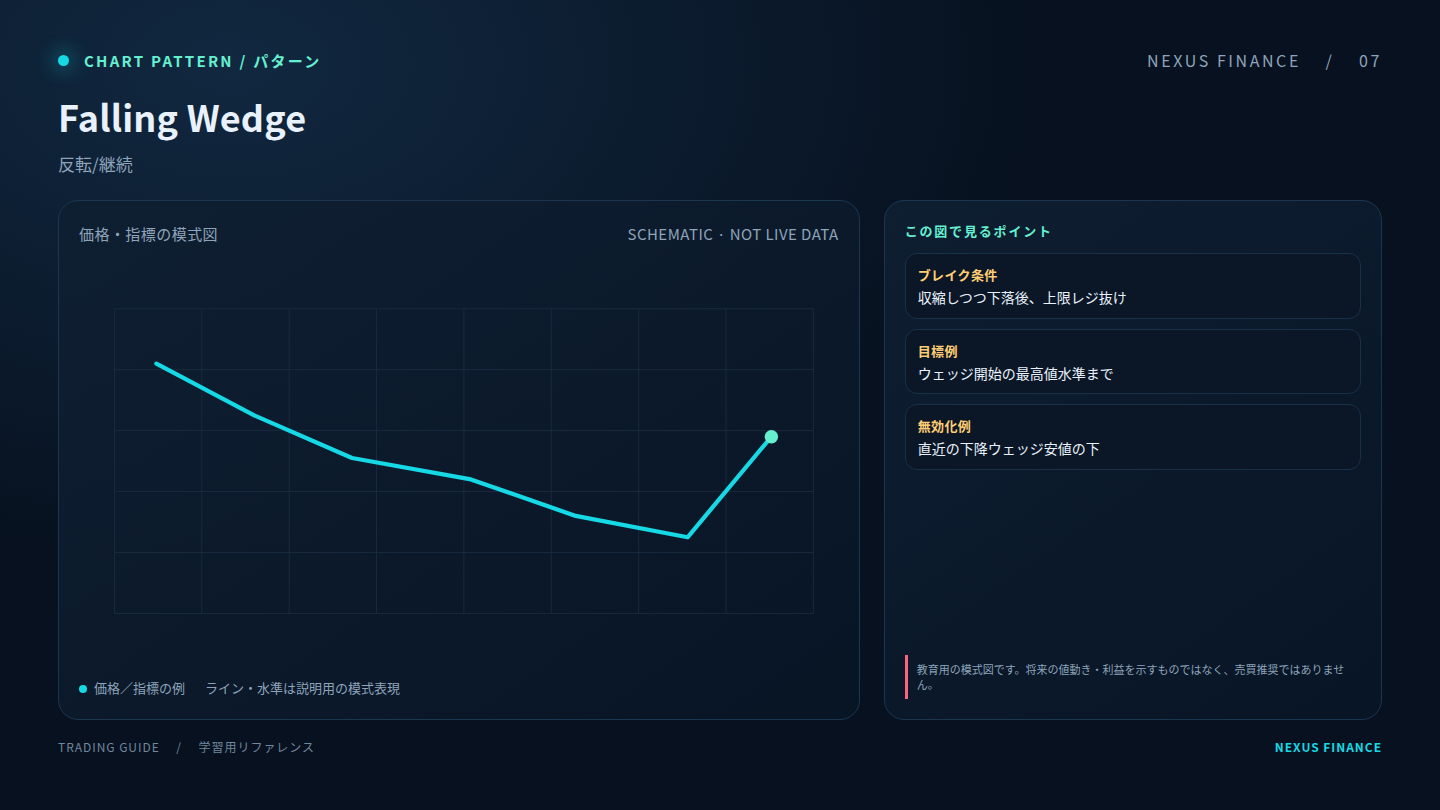 07
07Falling Wedge
A possible turning-point structure. Wait for a confirmed break, close or retest and define invalidation; a pattern can fail.
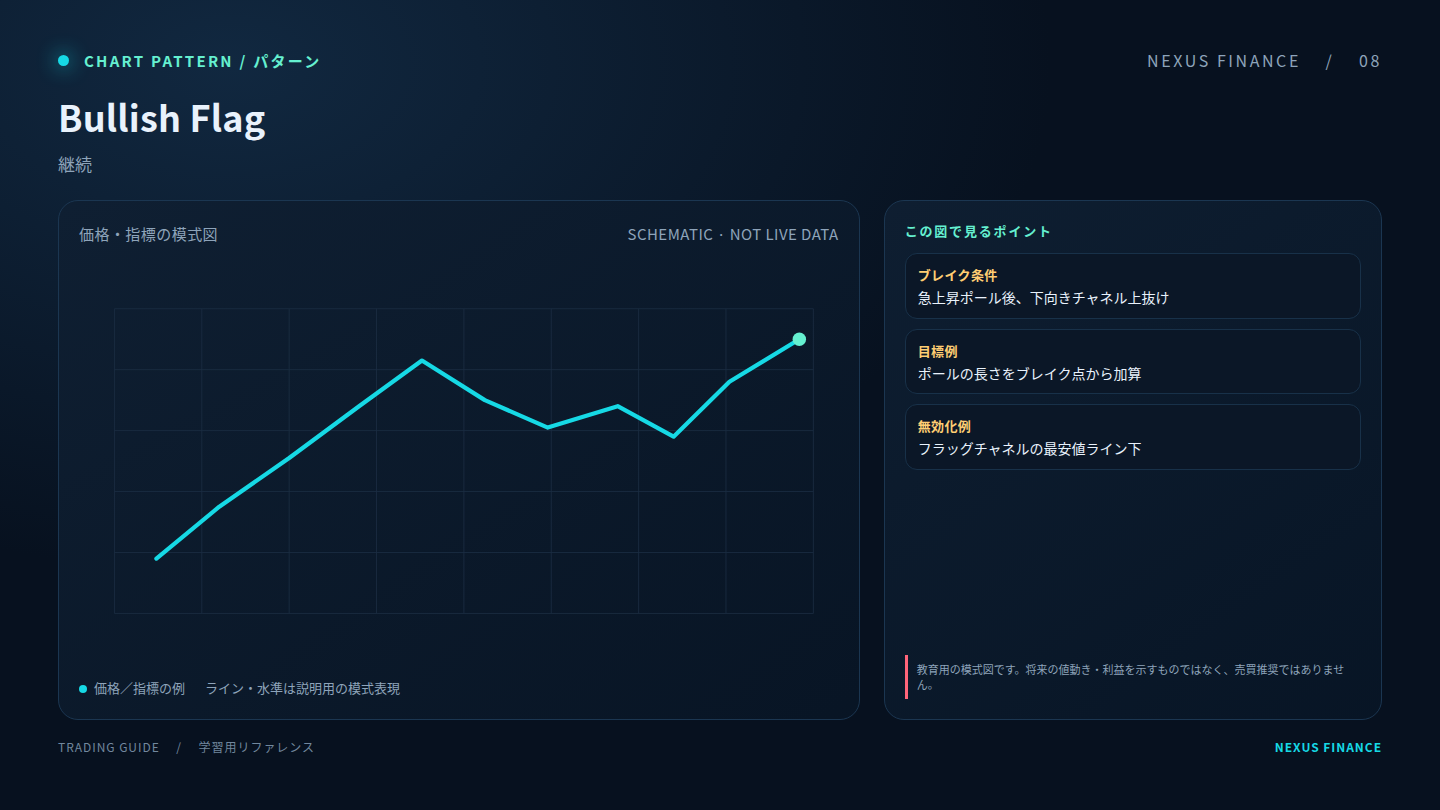 08
08Bullish Flag
A possible consolidation or continuation structure. Breakouts can be false, so use a close/confirmation rule and planned risk.
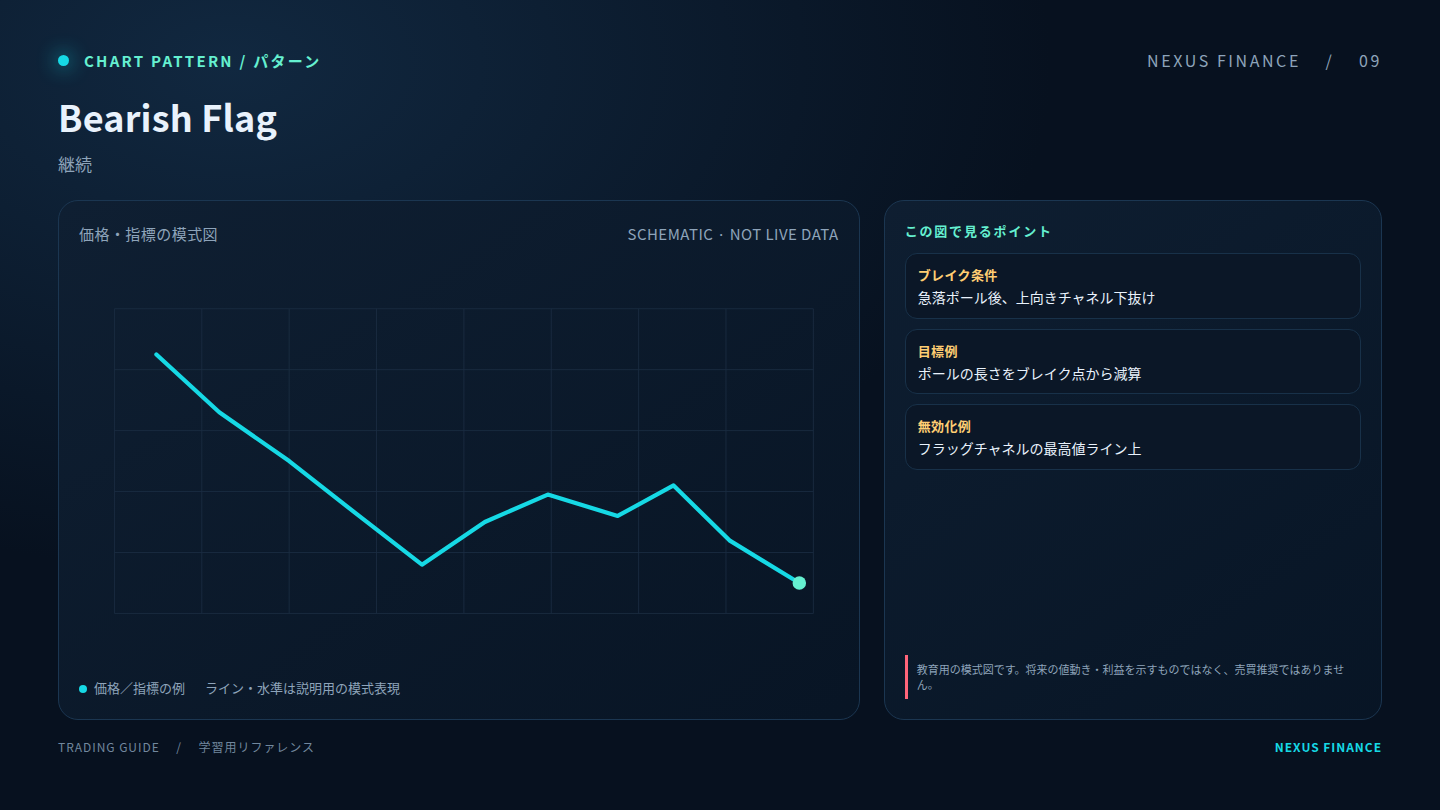 09
09Bearish Flag
A possible consolidation or continuation structure. Breakouts can be false, so use a close/confirmation rule and planned risk.
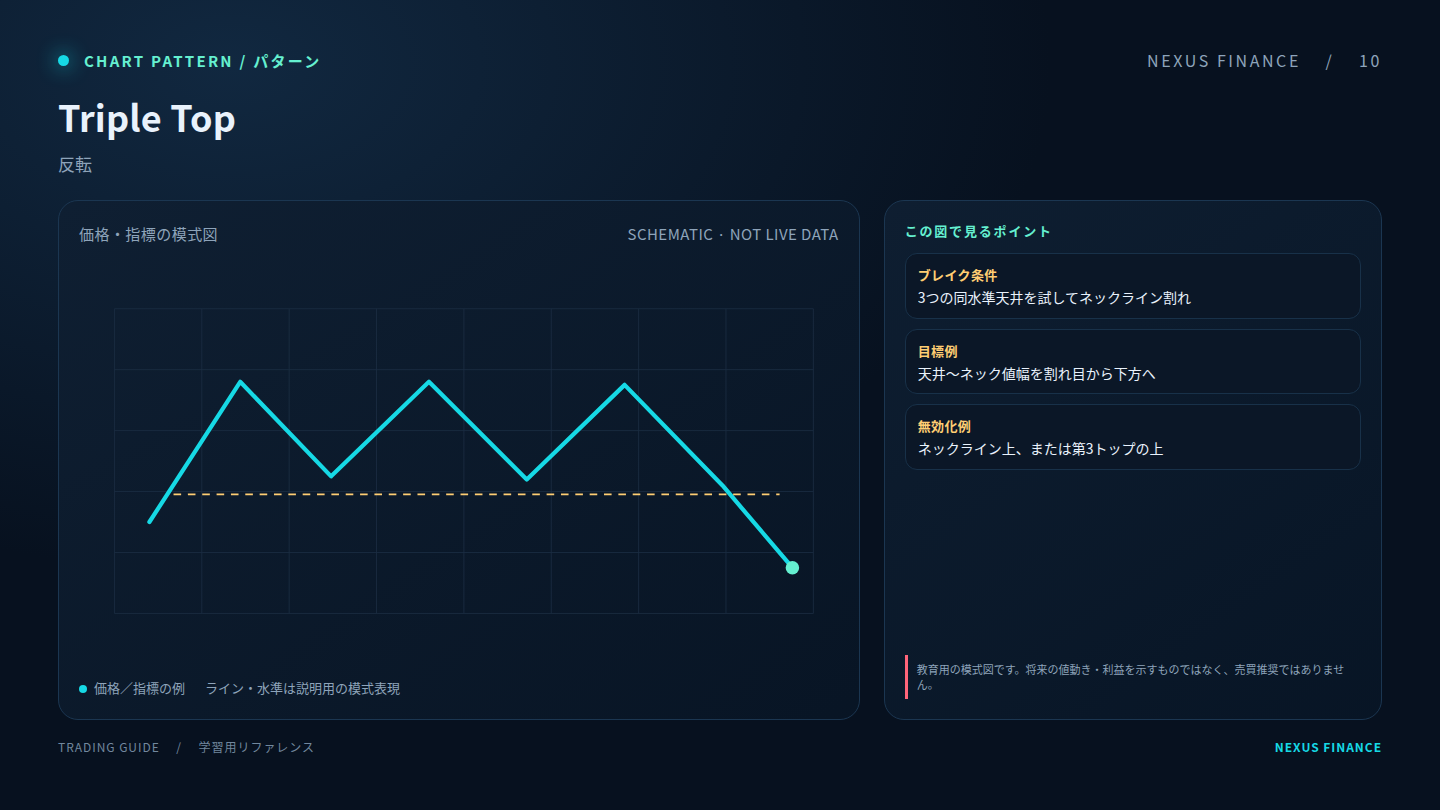 10
10Triple Top
A possible turning-point structure. Wait for a confirmed break, close or retest and define invalidation; a pattern can fail.
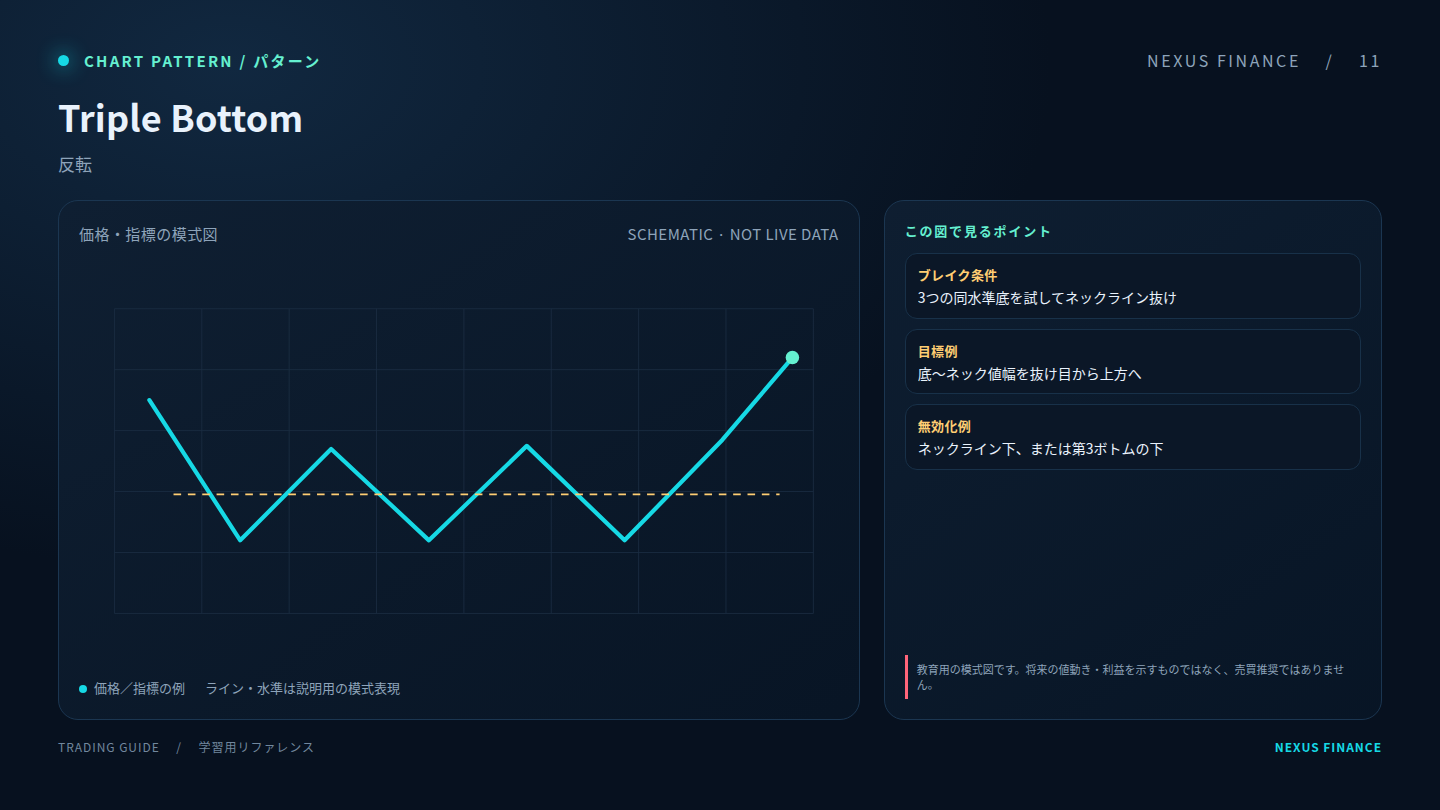 11
11Triple Bottom
A possible turning-point structure. Wait for a confirmed break, close or retest and define invalidation; a pattern can fail.
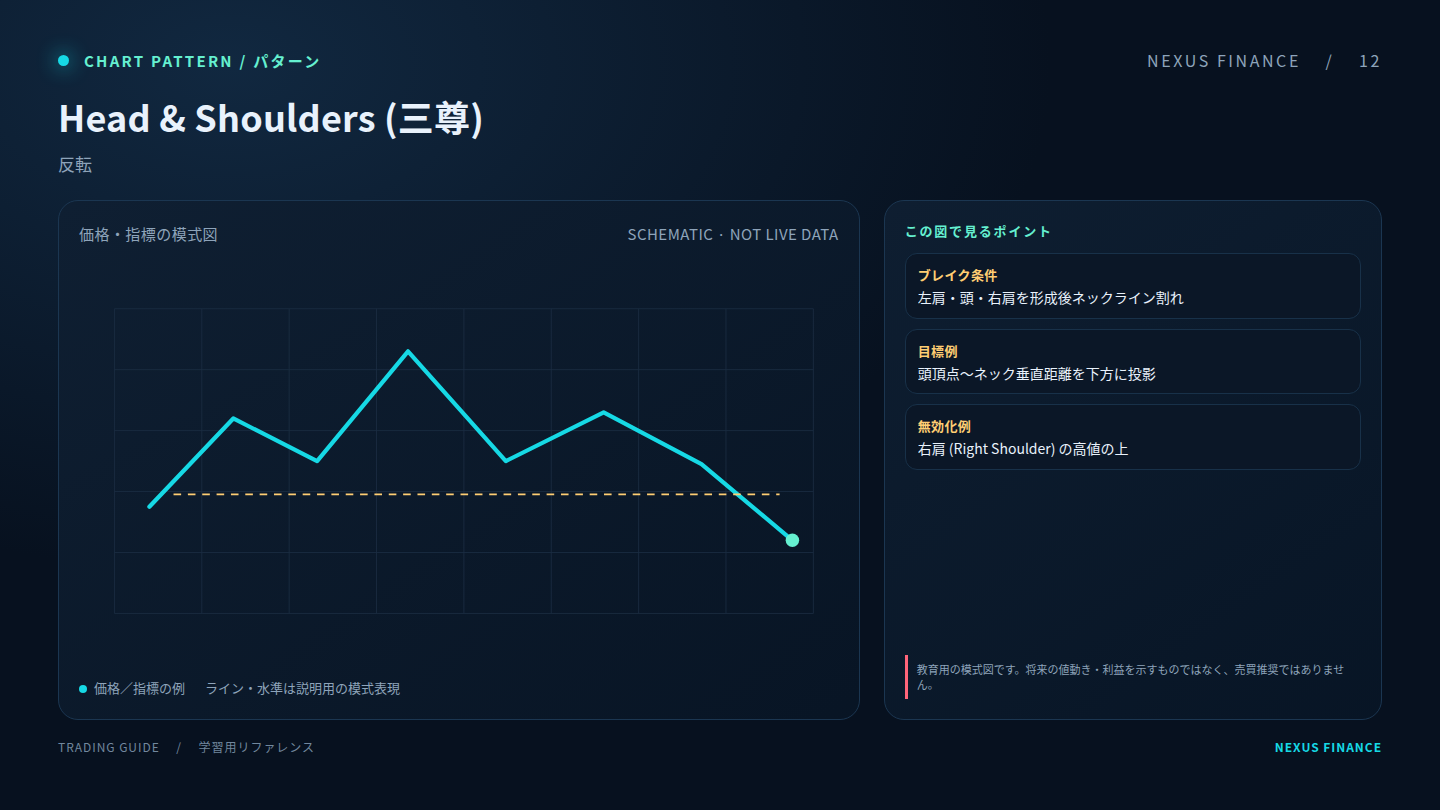 12
12Head & Shoulders
A possible turning-point structure. Wait for a confirmed break, close or retest and define invalidation; a pattern can fail.
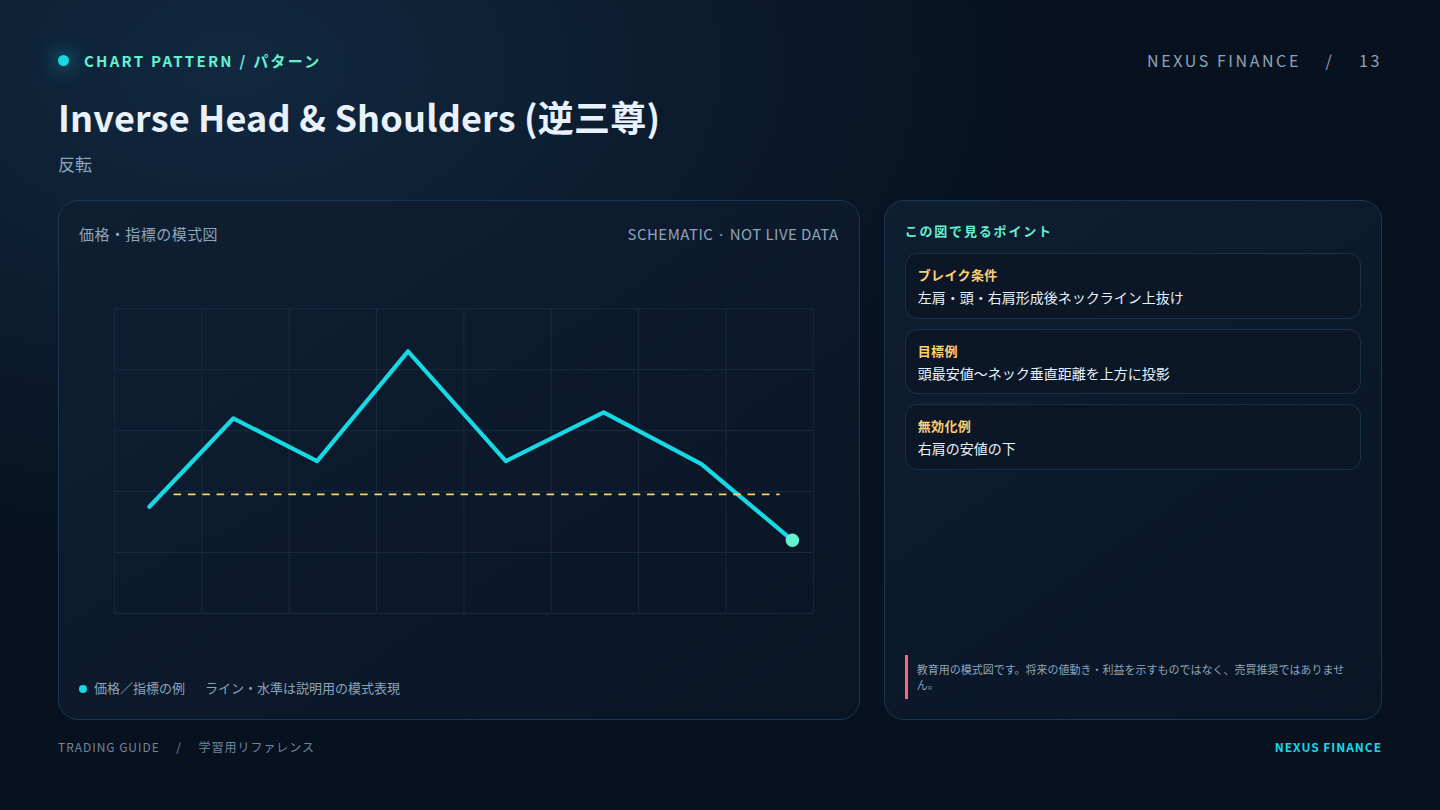 13
13Inverse Head & Shoulders
A possible turning-point structure. Wait for a confirmed break, close or retest and define invalidation; a pattern can fail.
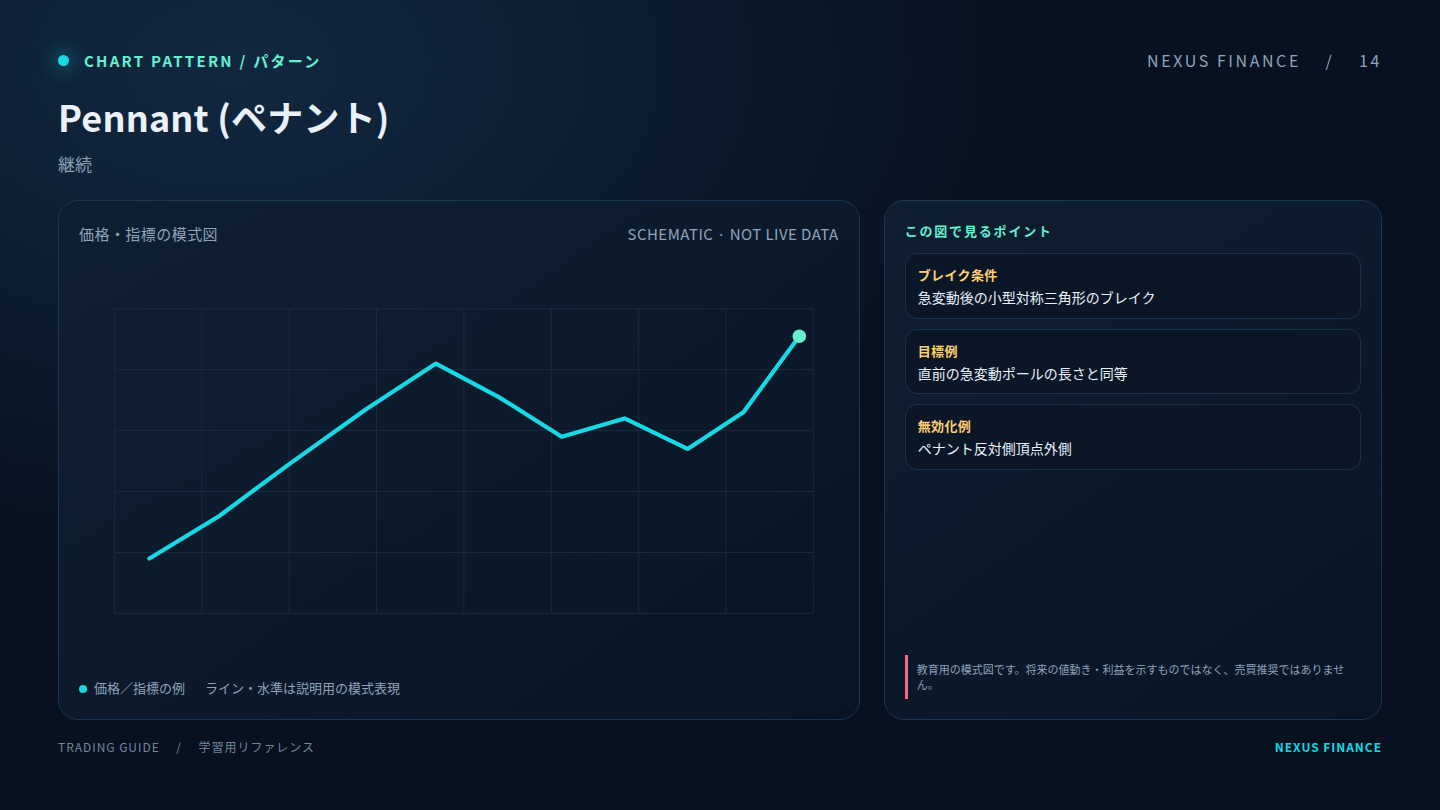 14
14Pennant
A possible consolidation or continuation structure. Breakouts can be false, so use a close/confirmation rule and planned risk.
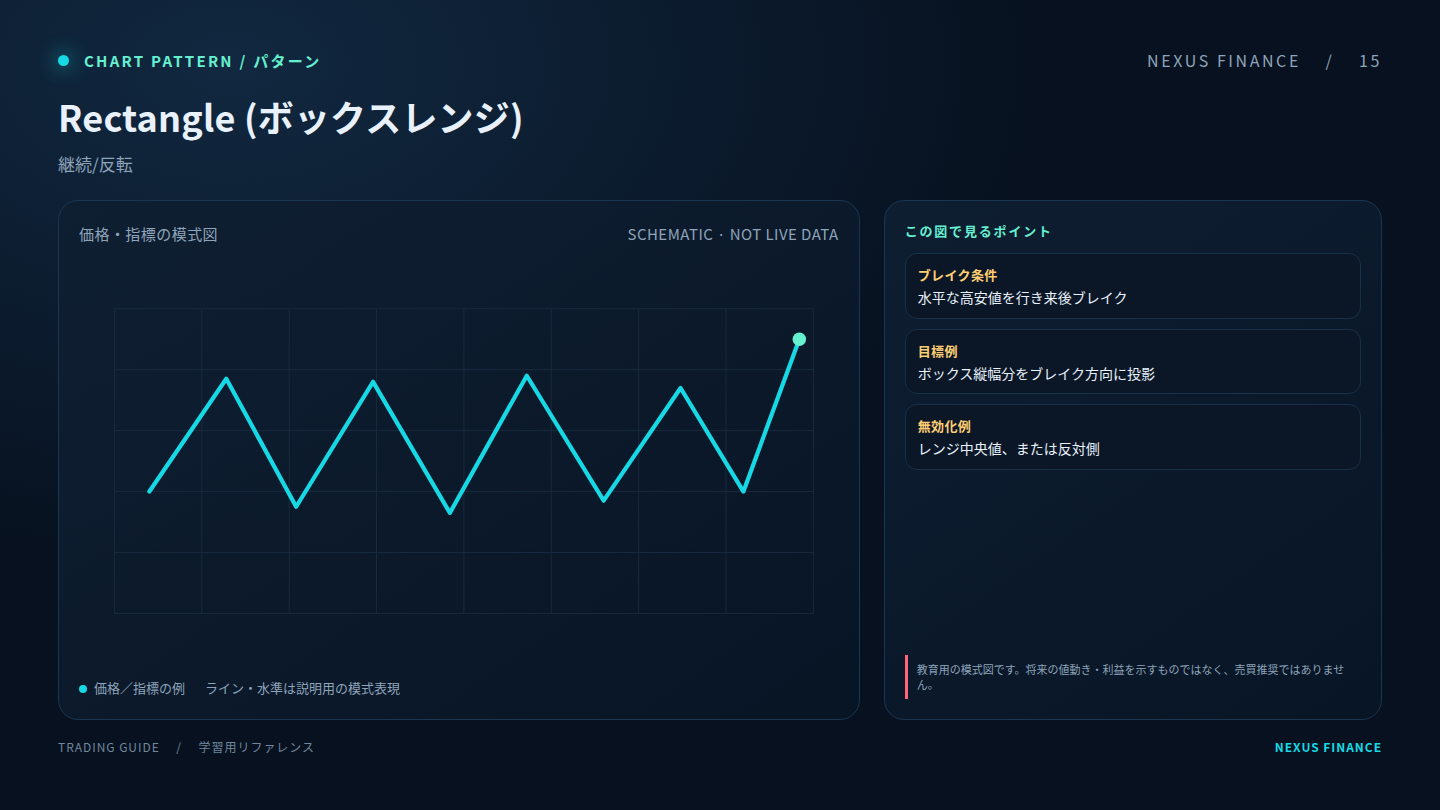 15
15Rectangle / Range
A possible consolidation or continuation structure. Breakouts can be false, so use a close/confirmation rule and planned risk.
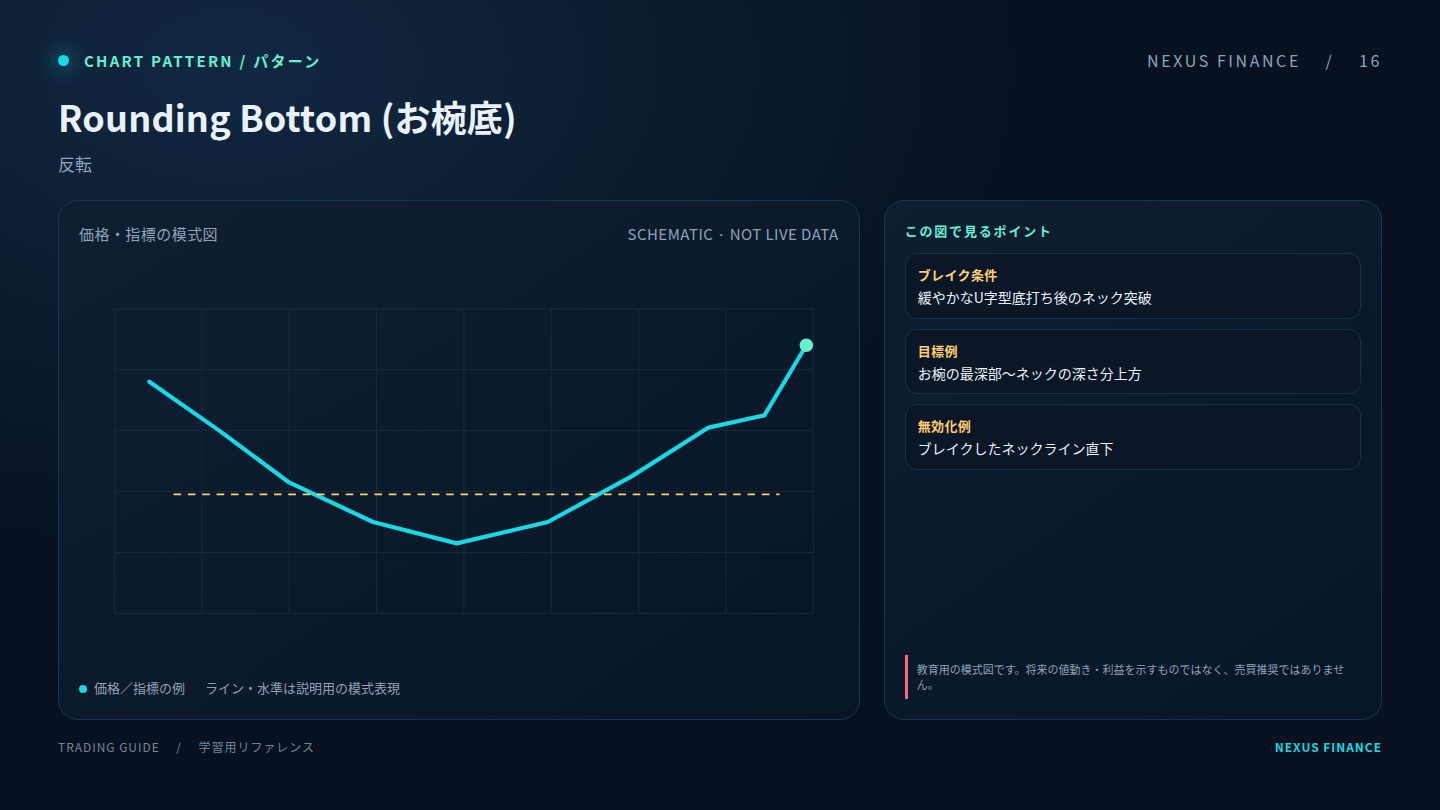 16
16Rounding Bottom
A possible turning-point structure. Wait for a confirmed break, close or retest and define invalidation; a pattern can fail.
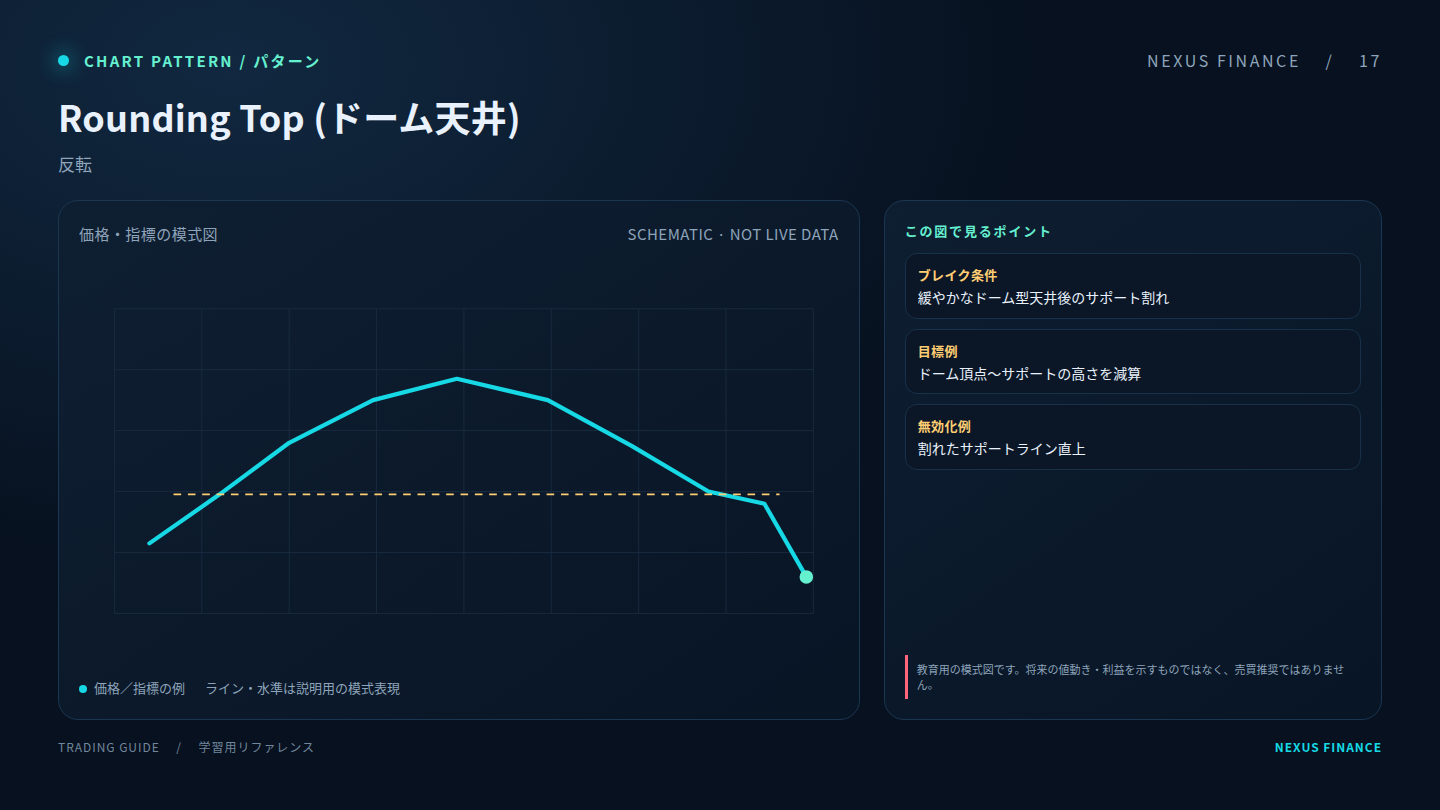 17
17Rounding Top
A possible turning-point structure. Wait for a confirmed break, close or retest and define invalidation; a pattern can fail.
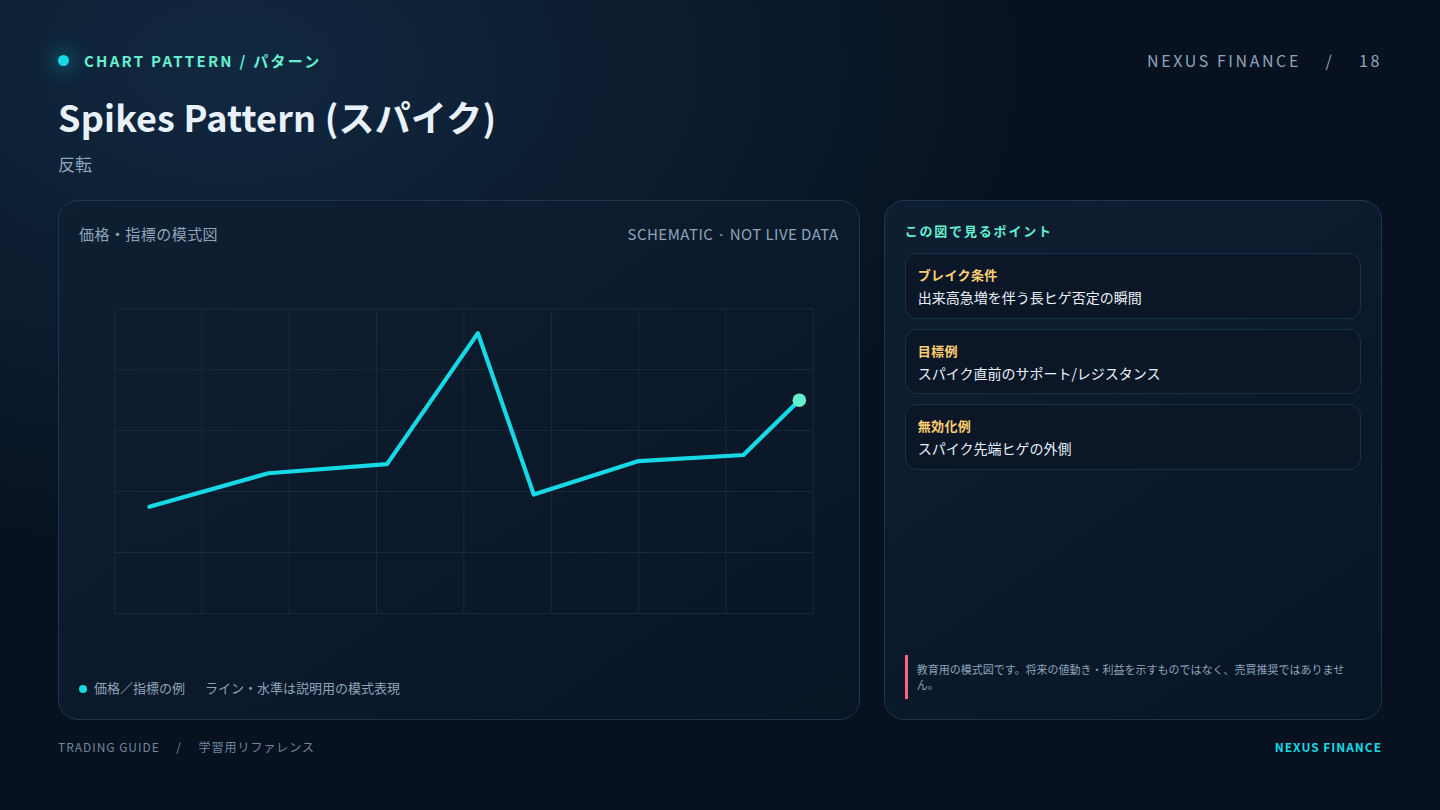 18
18Spike Reversal
A possible turning-point structure. Wait for a confirmed break, close or retest and define invalidation; a pattern can fail.
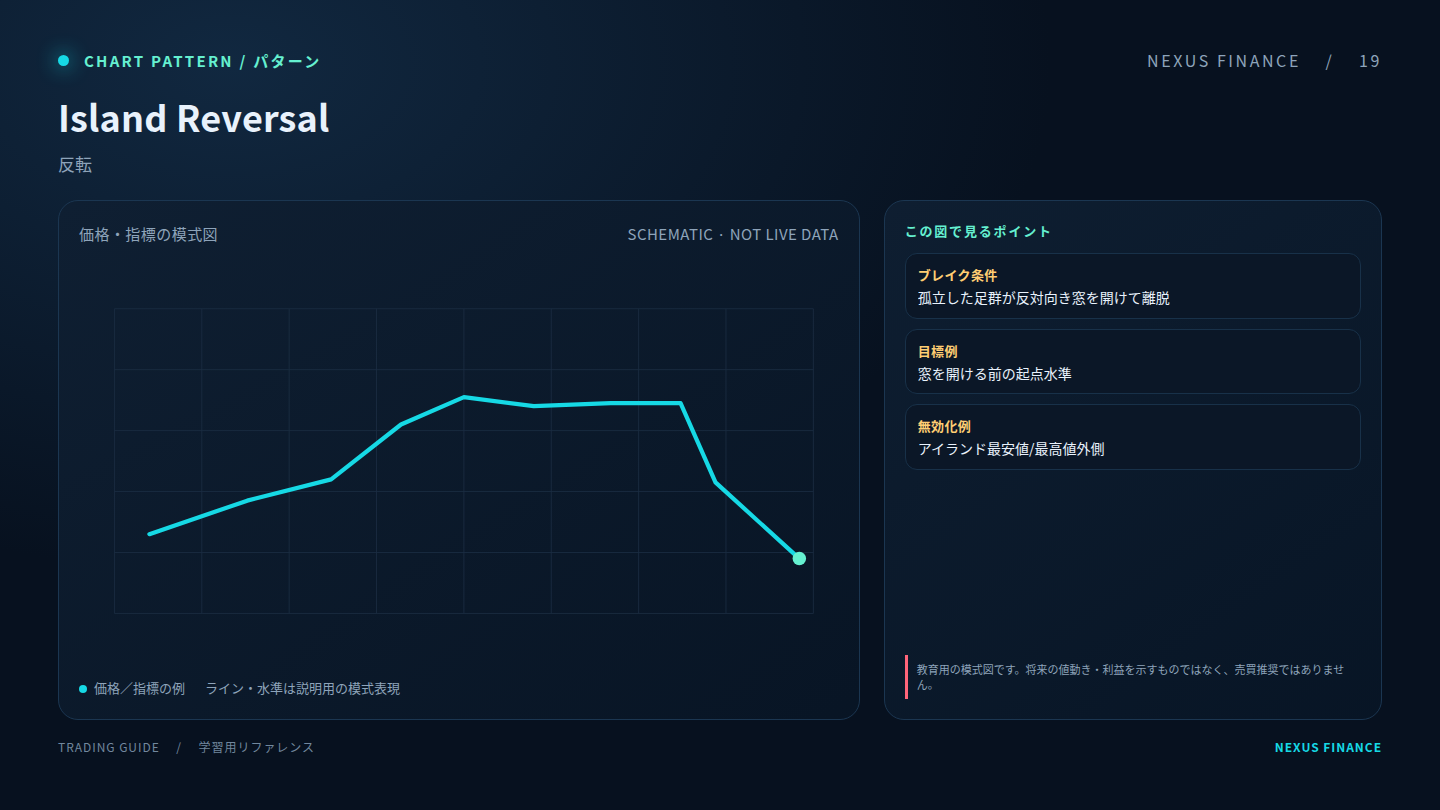 19
19Island Reversal
A possible turning-point structure. Wait for a confirmed break, close or retest and define invalidation; a pattern can fail.
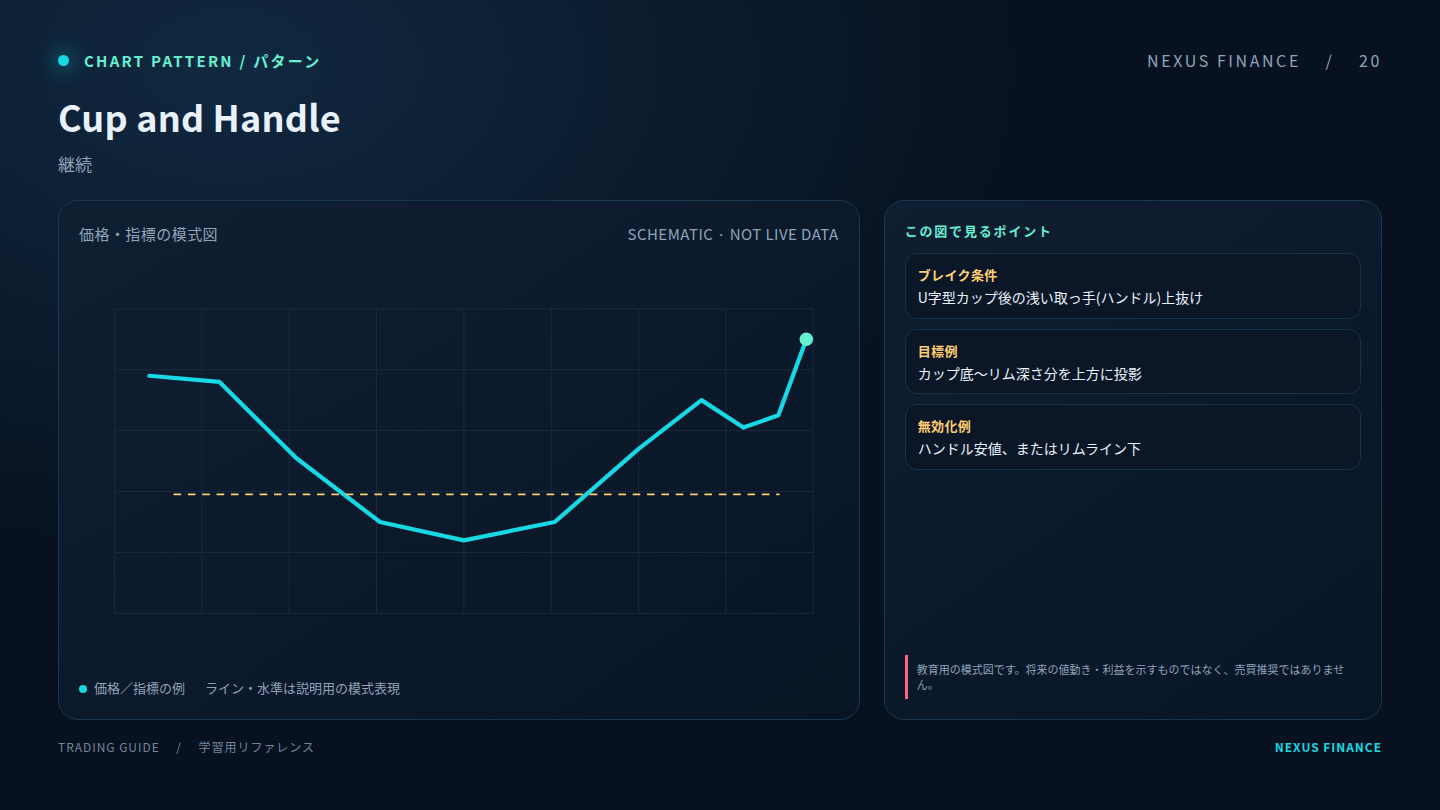 20
20Cup and Handle
A possible consolidation or continuation structure. Breakouts can be false, so use a close/confirmation rule and planned risk.
 21
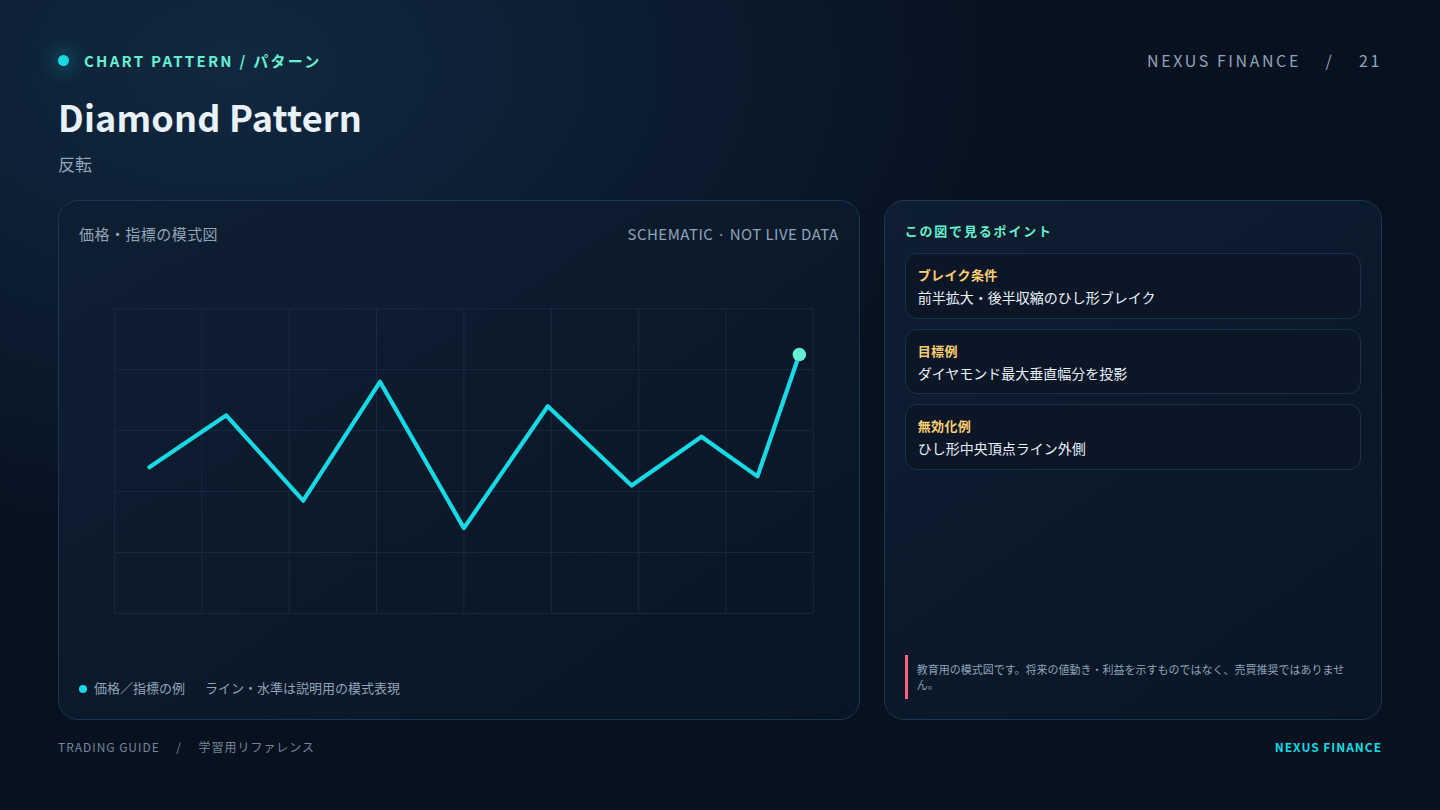
21Diamond Pattern
A possible turning-point structure. Wait for a confirmed break, close or retest and define invalidation; a pattern can fail.
Rules for named methods may differ by source or implementation. Document entry, stop, target, session and instruments, then test with fees and realistic execution.
Rules for named methods may differ by source or implementation. Document entry, stop, target, session and instruments, then test with fees and realistic execution.
Rules for named methods may differ by source or implementation. Document entry, stop, target, session and instruments, then test with fees and realistic execution.
Rules for named methods may differ by source or implementation. Document entry, stop, target, session and instruments, then test with fees and realistic execution.
Rules for named methods may differ by source or implementation. Document entry, stop, target, session and instruments, then test with fees and realistic execution.
Rules for named methods may differ by source or implementation. Document entry, stop, target, session and instruments, then test with fees and realistic execution.
Rules for named methods may differ by source or implementation. Document entry, stop, target, session and instruments, then test with fees and realistic execution.
Rules for named methods may differ by source or implementation. Document entry, stop, target, session and instruments, then test with fees and realistic execution.
Rules for named methods may differ by source or implementation. Document entry, stop, target, session and instruments, then test with fees and realistic execution.
Rules for named methods may differ by source or implementation. Document entry, stop, target, session and instruments, then test with fees and realistic execution.
Rules for named methods may differ by source or implementation. Document entry, stop, target, session and instruments, then test with fees and realistic execution.
Rules for named methods may differ by source or implementation. Document entry, stop, target, session and instruments, then test with fees and realistic execution.
Rules for named methods may differ by source or implementation. Document entry, stop, target, session and instruments, then test with fees and realistic execution.
Rules for named methods may differ by source or implementation. Document entry, stop, target, session and instruments, then test with fees and realistic execution.
Rules for named methods may differ by source or implementation. Document entry, stop, target, session and instruments, then test with fees and realistic execution.
Rules for named methods may differ by source or implementation. Document entry, stop, target, session and instruments, then test with fees and realistic execution.
Rules for named methods may differ by source or implementation. Document entry, stop, target, session and instruments, then test with fees and realistic execution.
Rules for named methods may differ by source or implementation. Document entry, stop, target, session and instruments, then test with fees and realistic execution.
Rules for named methods may differ by source or implementation. Document entry, stop, target, session and instruments, then test with fees and realistic execution.
Rules for named methods may differ by source or implementation. Document entry, stop, target, session and instruments, then test with fees and realistic execution.
Rules for named methods may differ by source or implementation. Document entry, stop, target, session and instruments, then test with fees and realistic execution.
Rules for named methods may differ by source or implementation. Document entry, stop, target, session and instruments, then test with fees and realistic execution.
Rules for named methods may differ by source or implementation. Document entry, stop, target, session and instruments, then test with fees and realistic execution.
Rules for named methods may differ by source or implementation. Document entry, stop, target, session and instruments, then test with fees and realistic execution.
Rules for named methods may differ by source or implementation. Document entry, stop, target, session and instruments, then test with fees and realistic execution.
Rules for named methods may differ by source or implementation. Document entry, stop, target, session and instruments, then test with fees and realistic execution.
Rules for named methods may differ by source or implementation. Document entry, stop, target, session and instruments, then test with fees and realistic execution.
Rules for named methods may differ by source or implementation. Document entry, stop, target, session and instruments, then test with fees and realistic execution.
Rules for named methods may differ by source or implementation. Document entry, stop, target, session and instruments, then test with fees and realistic execution.
Rules for named methods may differ by source or implementation. Document entry, stop, target, session and instruments, then test with fees and realistic execution.
Rules for named methods may differ by source or implementation. Document entry, stop, target, session and instruments, then test with fees and realistic execution.
Rules for named methods may differ by source or implementation. Document entry, stop, target, session and instruments, then test with fees and realistic execution.
Rules for named methods may differ by source or implementation. Document entry, stop, target, session and instruments, then test with fees and realistic execution.
Rules for named methods may differ by source or implementation. Document entry, stop, target, session and instruments, then test with fees and realistic execution.
Rules for named methods may differ by source or implementation. Document entry, stop, target, session and instruments, then test with fees and realistic execution.
Rules for named methods may differ by source or implementation. Document entry, stop, target, session and instruments, then test with fees and realistic execution.
Rules for named methods may differ by source or implementation. Document entry, stop, target, session and instruments, then test with fees and realistic execution.
Rules for named methods may differ by source or implementation. Document entry, stop, target, session and instruments, then test with fees and realistic execution.
Rules for named methods may differ by source or implementation. Document entry, stop, target, session and instruments, then test with fees and realistic execution.
Rules for named methods may differ by source or implementation. Document entry, stop, target, session and instruments, then test with fees and realistic execution.
Rules for named methods may differ by source or implementation. Document entry, stop, target, session and instruments, then test with fees and realistic execution.
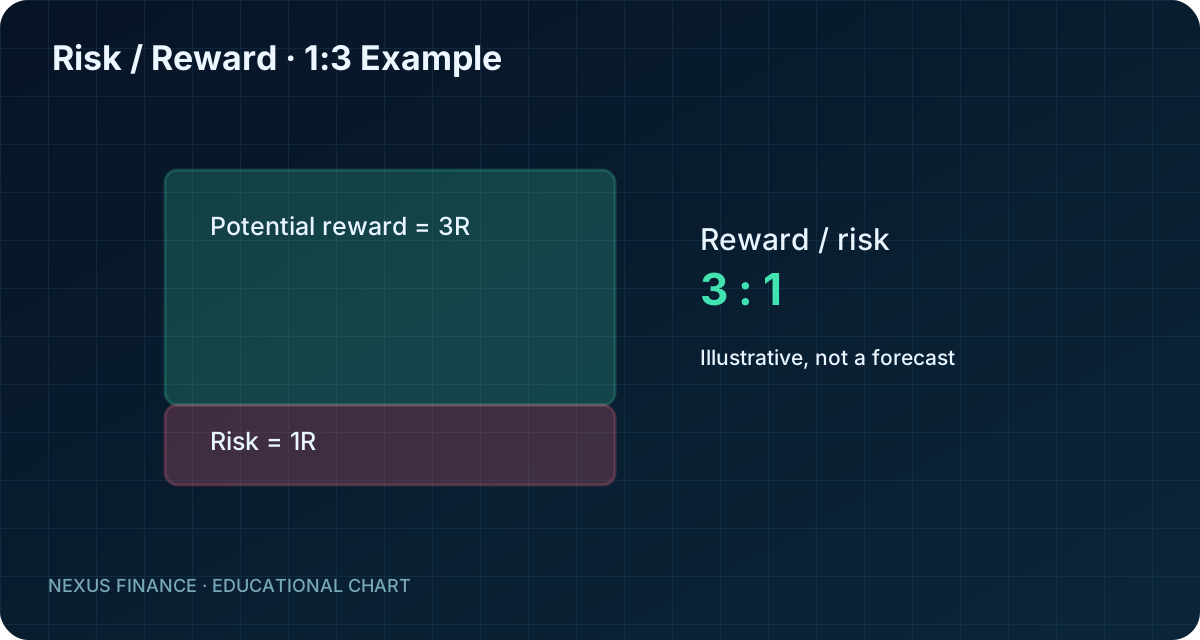
Assess expectancy with stop distance, win rate and costs—not the target distance alone.
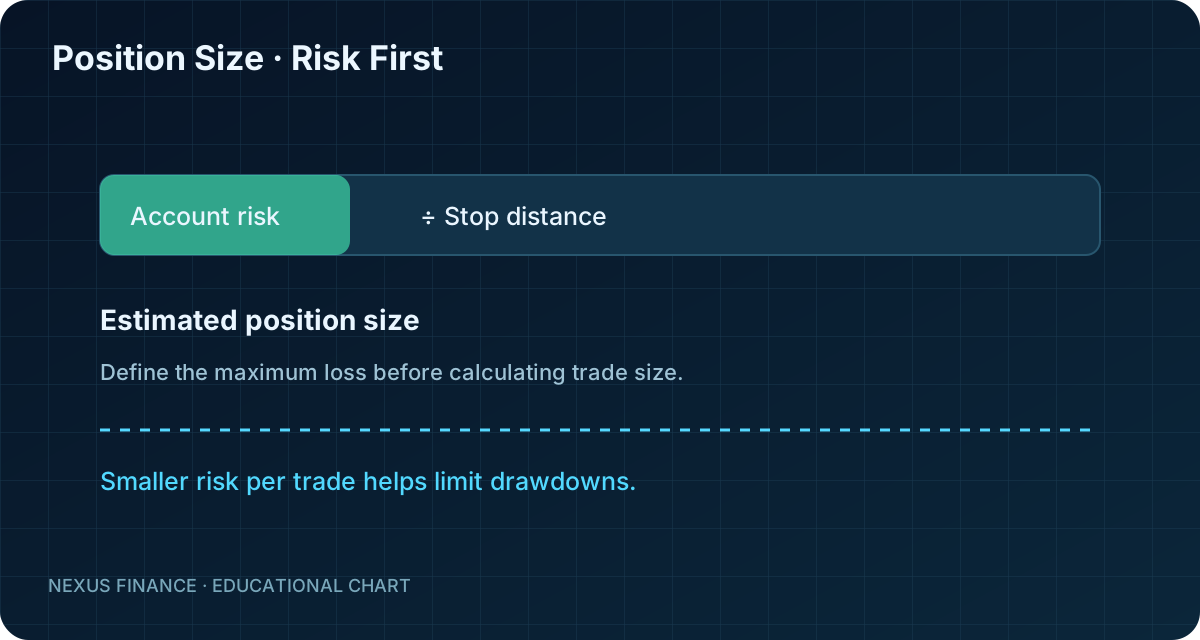
Set the maximum account loss first, then size the position to the stop distance.
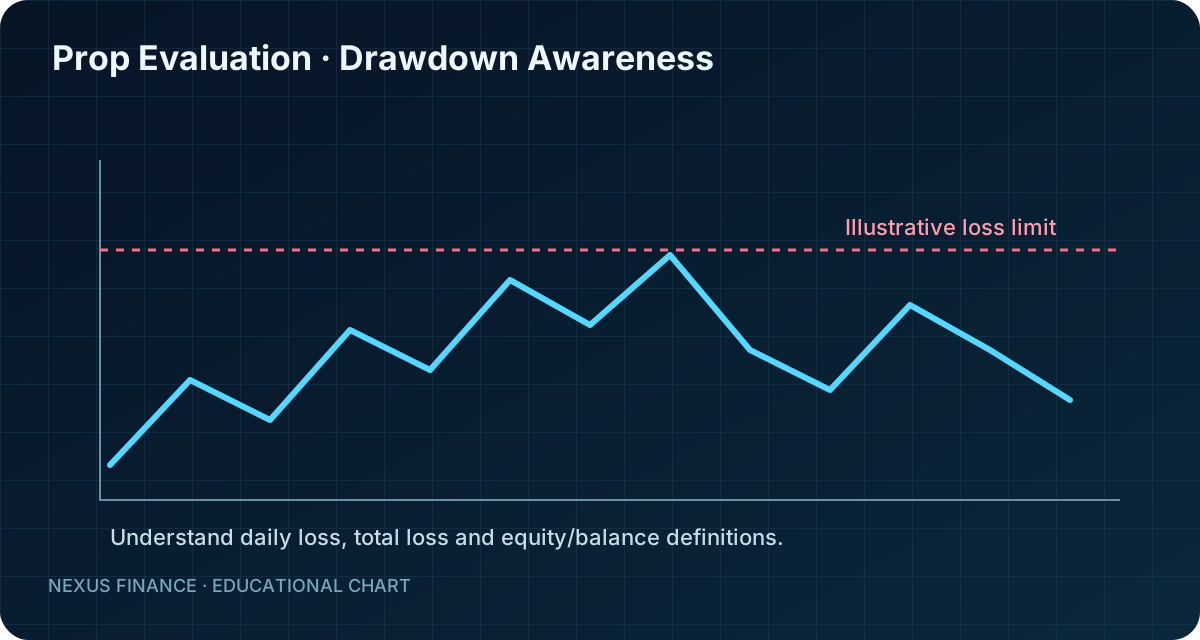
Provider terms can change. Do not assume current fees, regulation, access or rankings from this page; verify details with official sources before registering.
Prop Firms →Three FX/CFD brokers and three prop firms, plus FXGT and BingX. Rules and fees change, so check the official site before registering. This page contains affiliate links.
 FX / CFD broker
Check products, costs, regulation, leverage and eligible regions on the official site.
View Exness page → Official site ↗ FX / CFD broker
Check products, costs, regulation, leverage and eligible regions on the official site.
View XS page → Official site ↗ FX / CFD broker
Check products, costs, regulation, leverage and eligible regions on the official site.
View IC Markets page → Official site ↗ Prop firm
Check rules, loss limits, fees and payout terms on the official site.
View FTMO page → Official site ↗ Prop firm
Check rules, loss limits, fees and payout terms on the official site.
View Fintokei page → Official site ↗ Prop firm
Check rules, loss limits, fees and payout terms on the official site.
View The5ers page → Official site ↗Check products, costs, regulation, leverage and eligible regions on the official site.
View FXGT page → Official site ↗Check availability by region, fees, products and risks on the official site.
View BingX page → Official site ↗No. Listing order is not a ranking or endorsement. Compare official terms against your location, experience and trading approach.
Some links contain referral parameters. Where a referral commission may be earned, we disclose it and encourage review of official terms.
For education only, not investment advice. No indicator or pattern guarantees profits or predicts future prices with certainty.
Trading Services Directory · Forex & CFD Brokers · Prop Firms